
[Spring][Batch] Spring Batch Multithread
들어가며
영화 오픈 API를 이용한 프로젝트 진행 중 약 10000건 정도의 Batch 성 작업에 많은 시간이 소요됨에 따라 성능 개선을 위한 멀티 스레드 적용 여부 및 적용 스레드 개수 등의 테스트
Prometheus & Grafana 이용한 모니터링
- 의존성 추가
implementation 'org.springframework.boot:spring-boot-starter-actuator'
implementation 'io.micrometer:micrometer-registry-prometheus'
- Endpoint 활성화
management:
  endpoints:
    web:
      exposure:
        include: "*"
- Prometheus와 Grafana는 도커 이미지를 이용하여 컨테이너로 실행했다. 자바 웹 애플리케이션에서
/actuator/prometheus경로로 모니터링 정보를 push하고 Prometheus는 해당 경로에서 자료를 pull한다. 이를 도식화하여 볼 수 있도록 Grafana의 DataSource를 Prometheus로 설정한다.
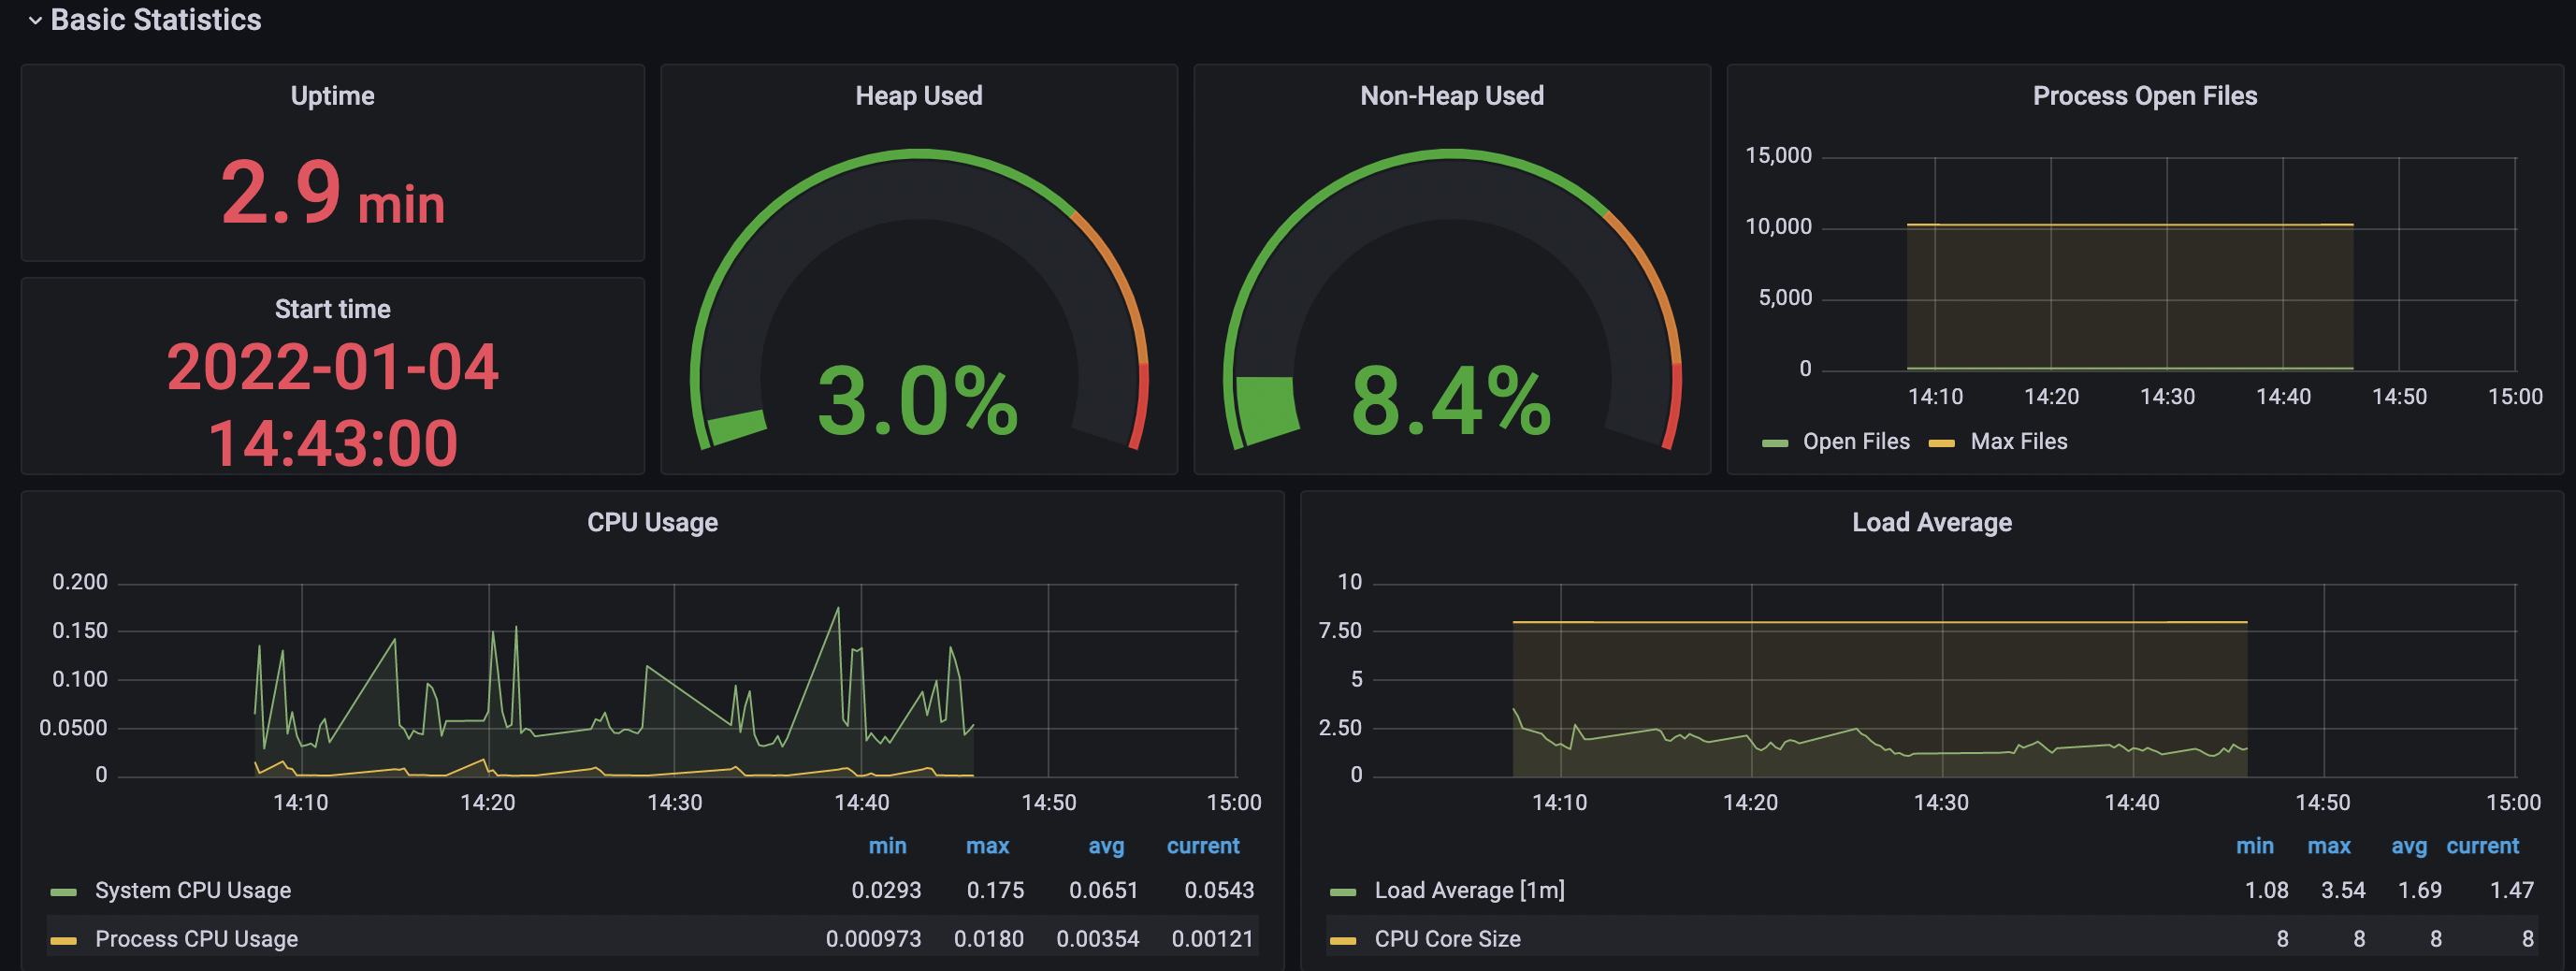
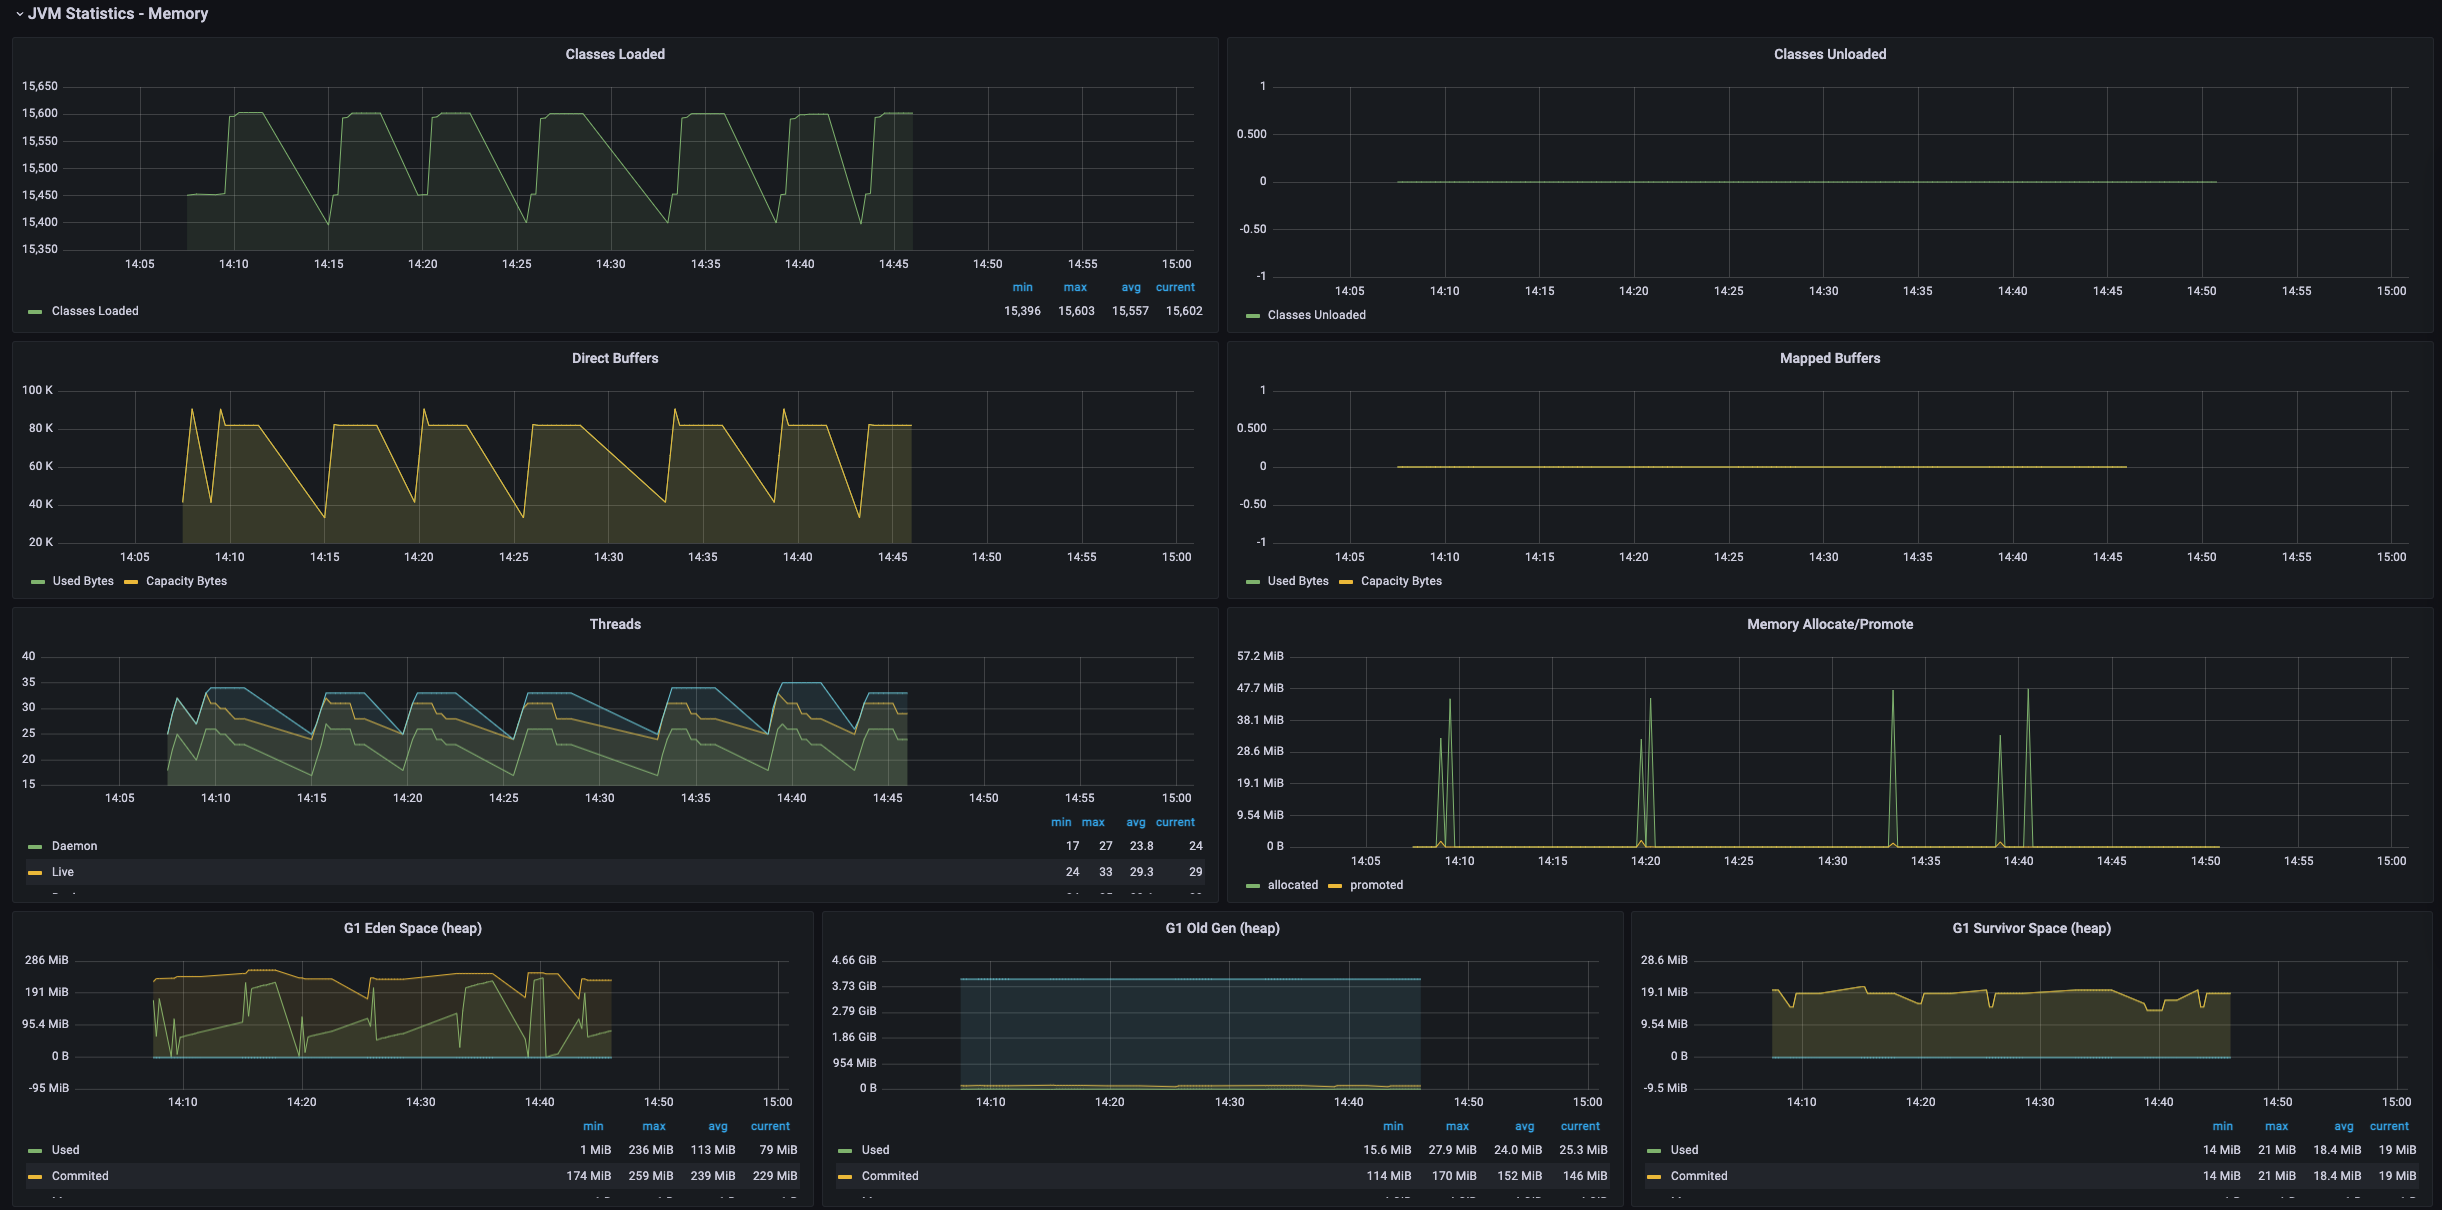
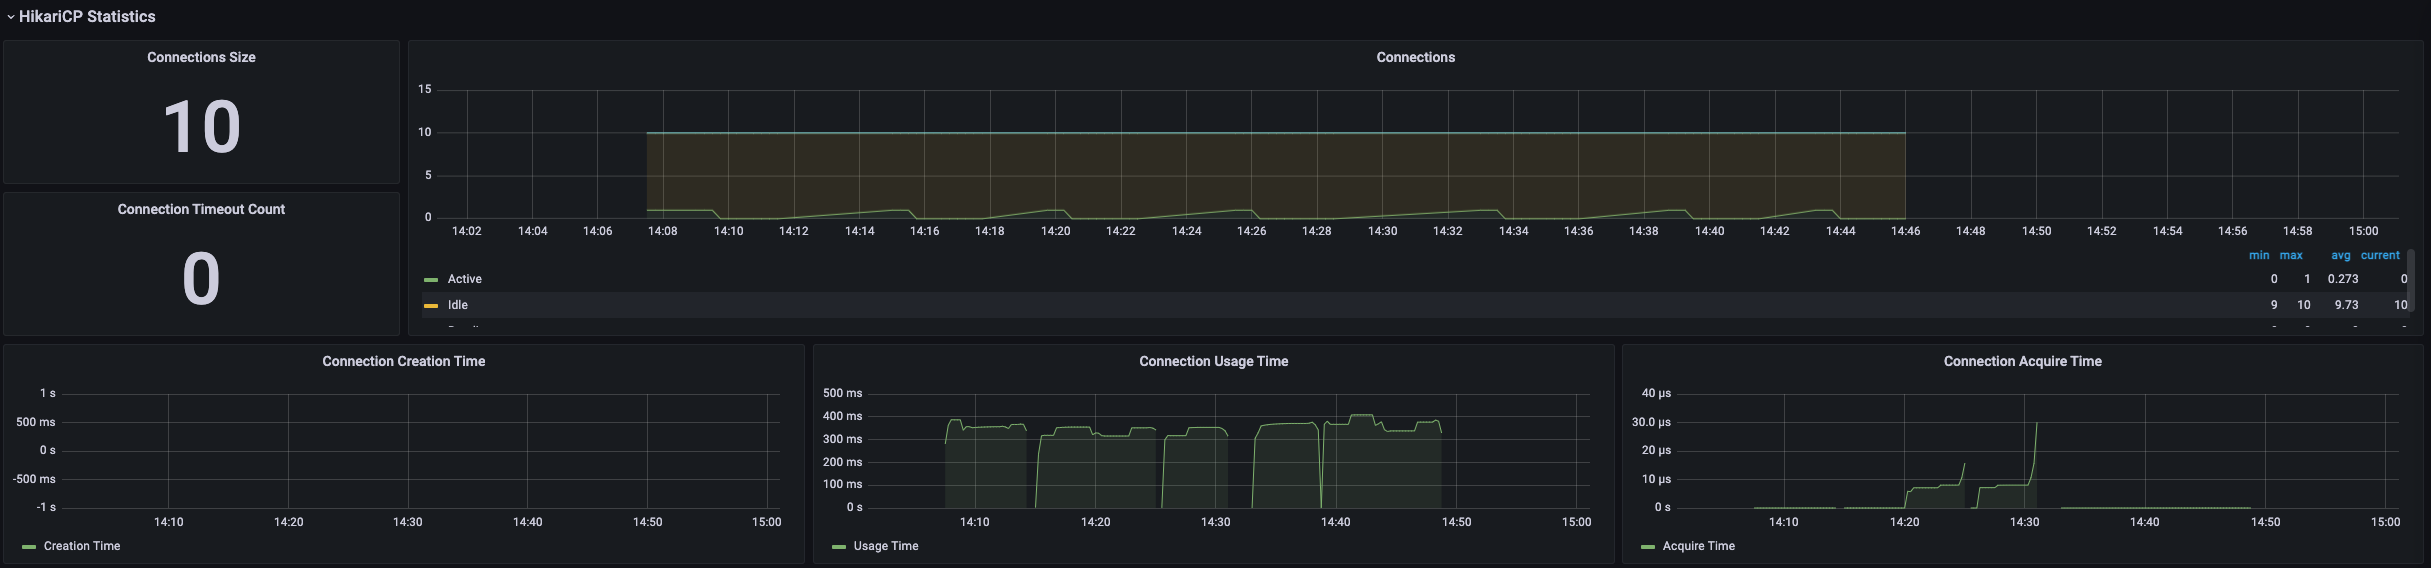
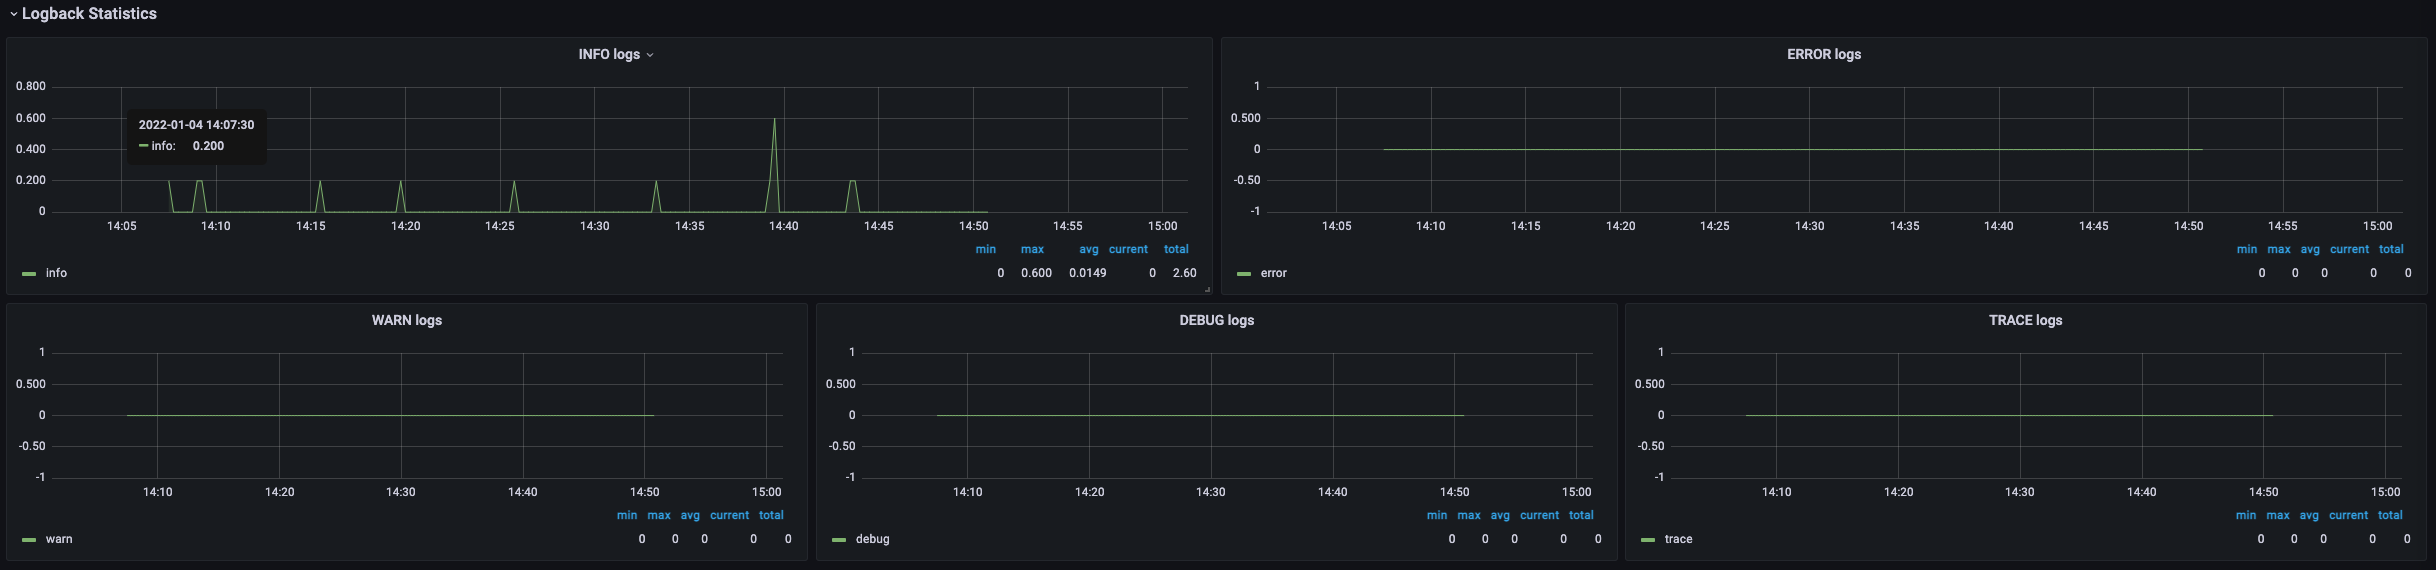
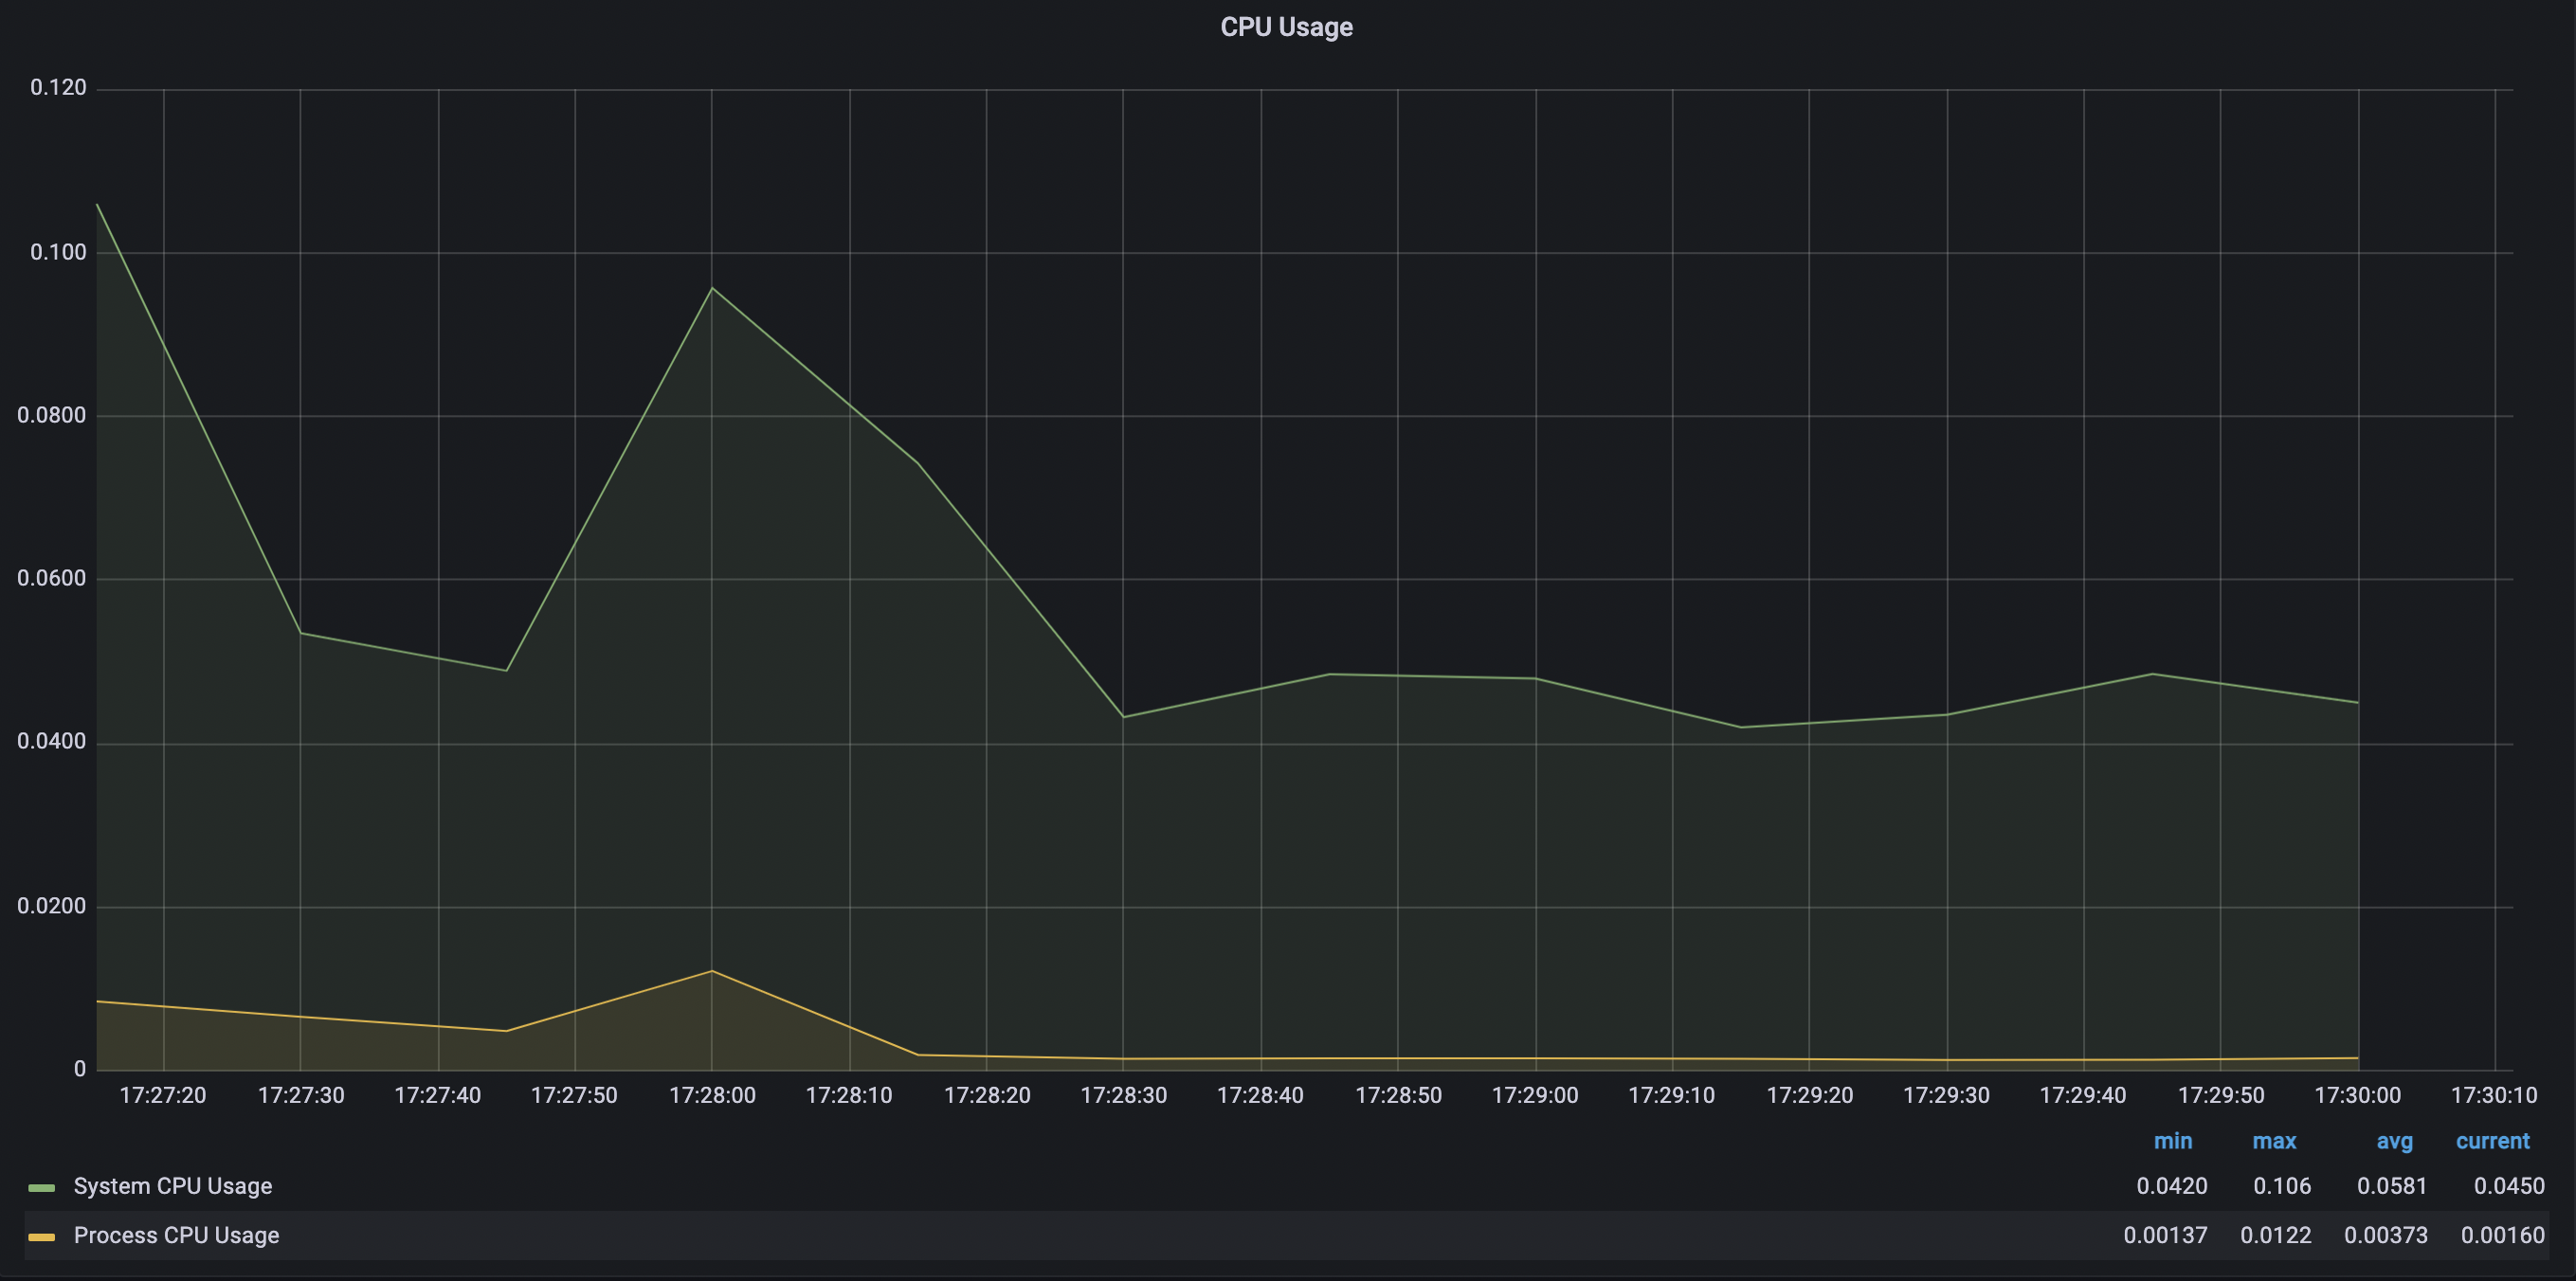
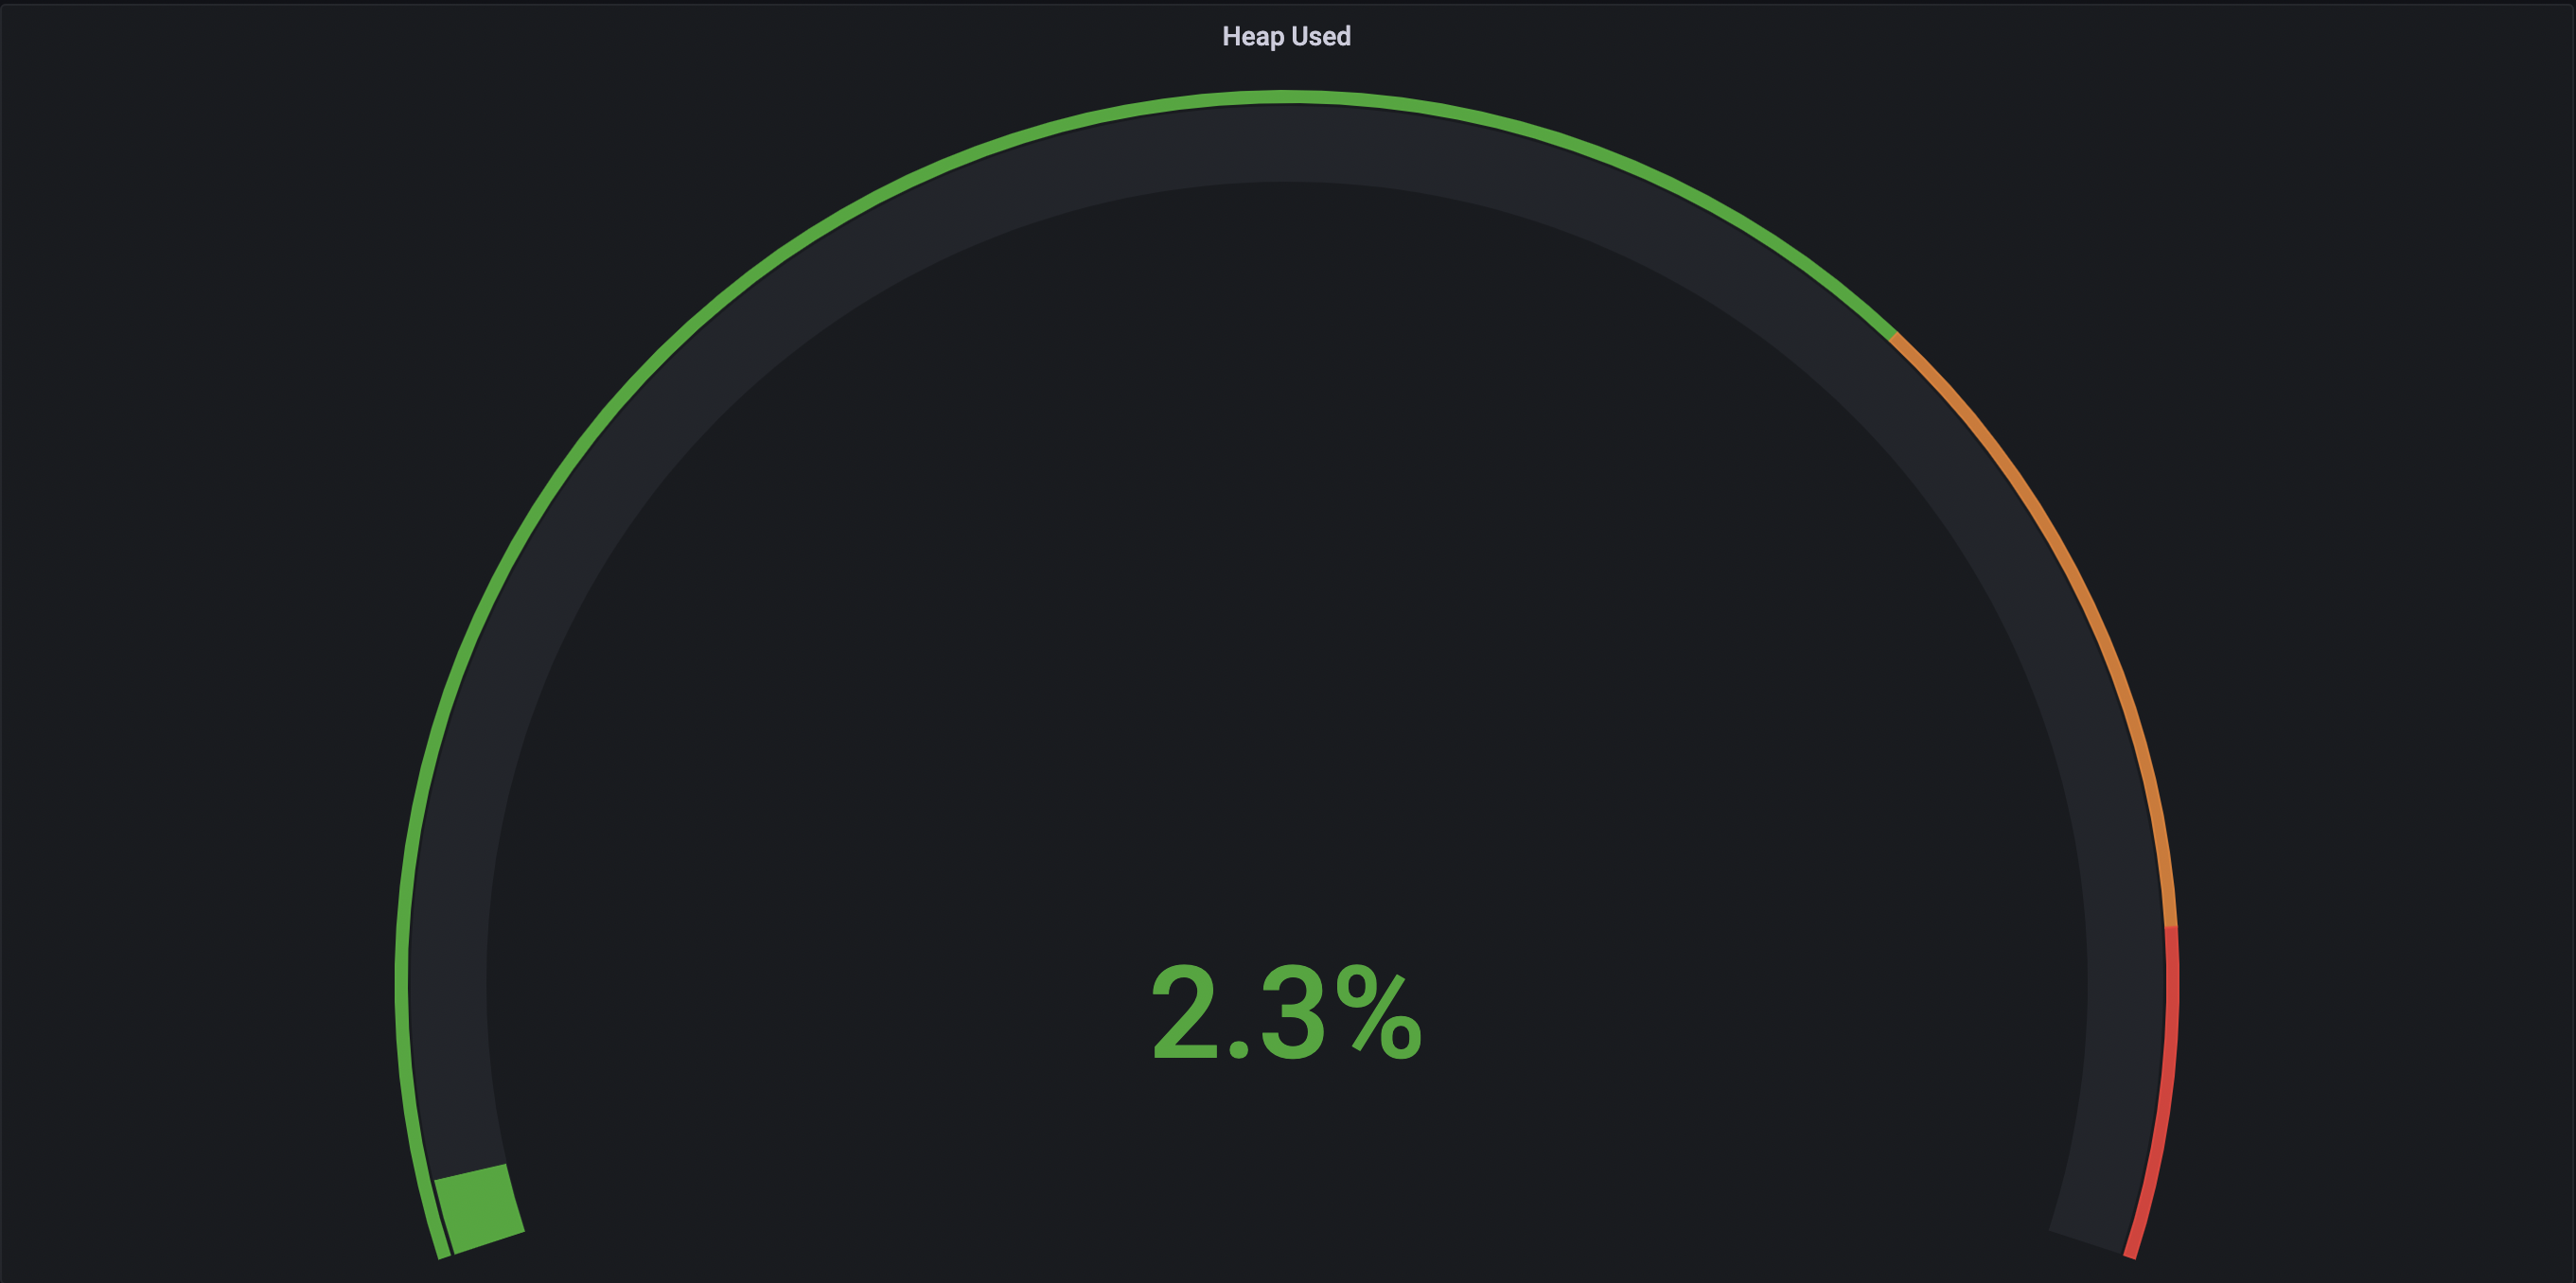
- cpu 사용량, 메모리 사용량, 자바 DB 커넥션 지표, HTTP 지표 등을 모니터링 할 수 있다.
외부 API 통신 Step Partioning
멀티 스레드 작업을 위해 API 통신을 위한 STEP을 partition 했다.
Partitioner: 스레드 개수에 맞춰서 partition의 개수를 조절할 수 있다.
@Component
public class RangePartitioner implements Partitioner {
    @Override
    public Map<String, ExecutionContext> partition(int gridSize) {
        HashMap<String, ExecutionContext> result = new HashMap<>();
        int firstPage = 1;
        int lastPage = 25;
        int count = 0;

        while (lastPage <= 100) {
            ExecutionContext executionContext = new ExecutionContext();
            result.put("partition " + count++, executionContext);

            executionContext.putInt("firstPage", firstPage);
            executionContext.putInt("lastPage", lastPage);

            firstPage += 25;
            lastPage += 25;
        }

        return result;
    }
}
TaskExecutor: 테스트를 위한 스레드의 개수를 조절한다.
@Bean
public TaskExecutor taskExecutor() {
    ThreadPoolTaskExecutor threadPoolExecutor = new ThreadPoolTaskExecutor();
    threadPoolExecutor.setCorePoolSize(?);
    threadPoolExecutor.setMaxPoolSize(?);
    threadPoolExecutor.setThreadNamePrefix("yhw-movieRank-");

    return threadPoolExecutor;
}
테스트 결과
- 스레드 1개
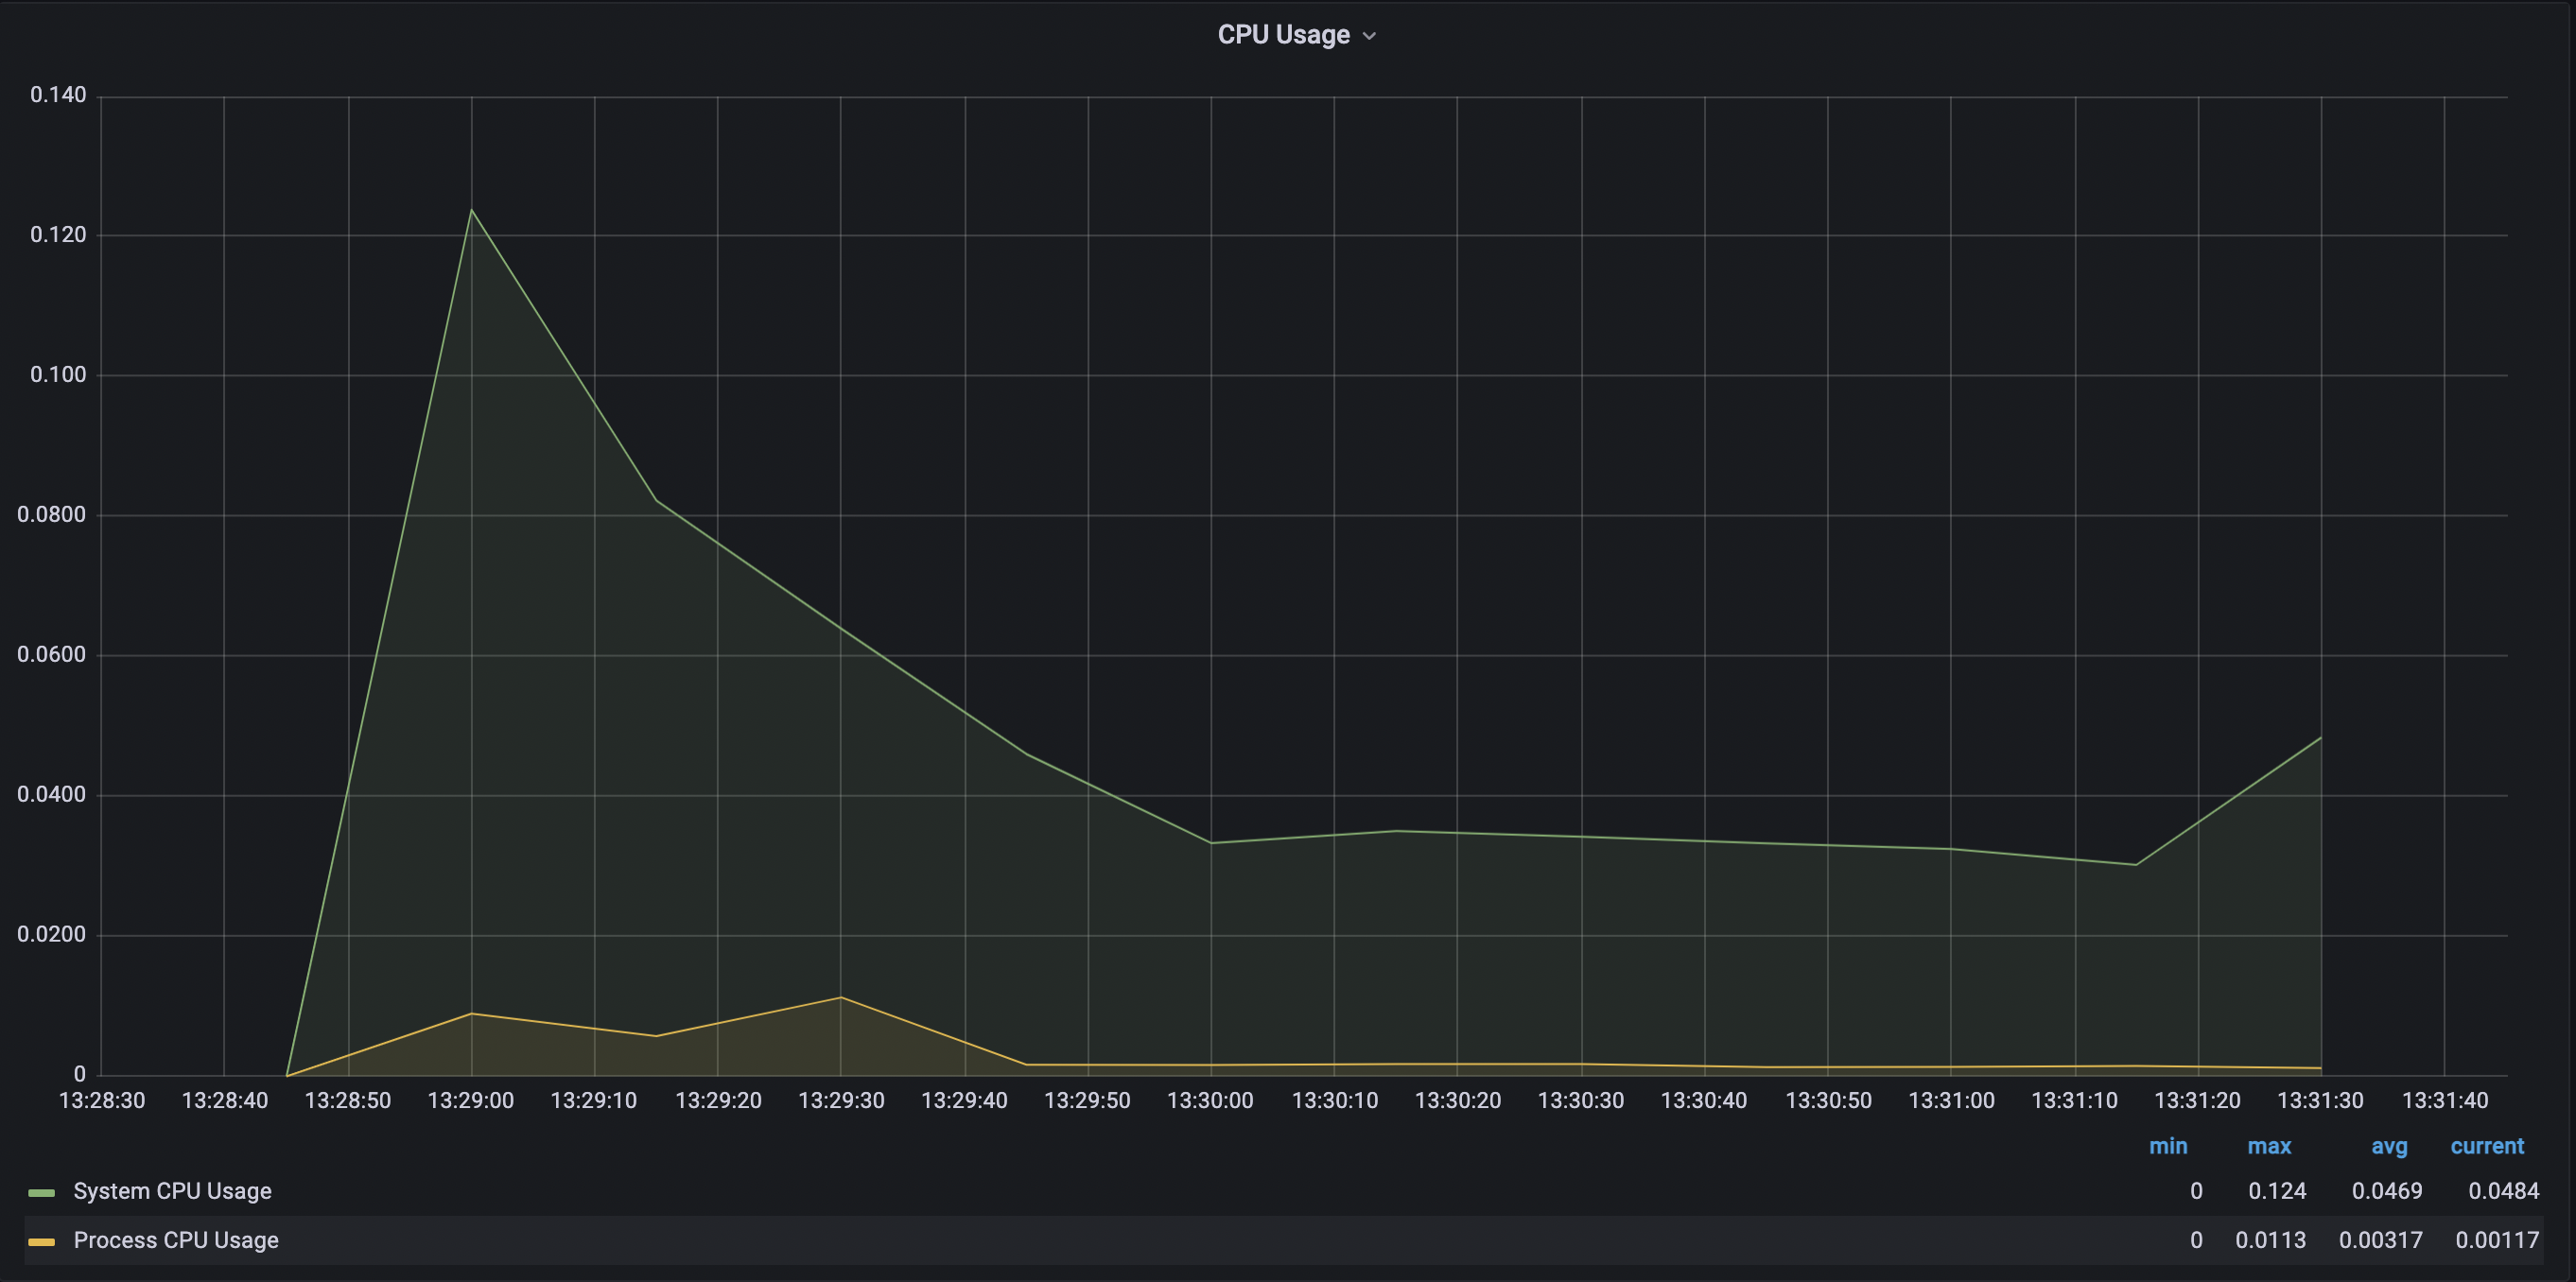
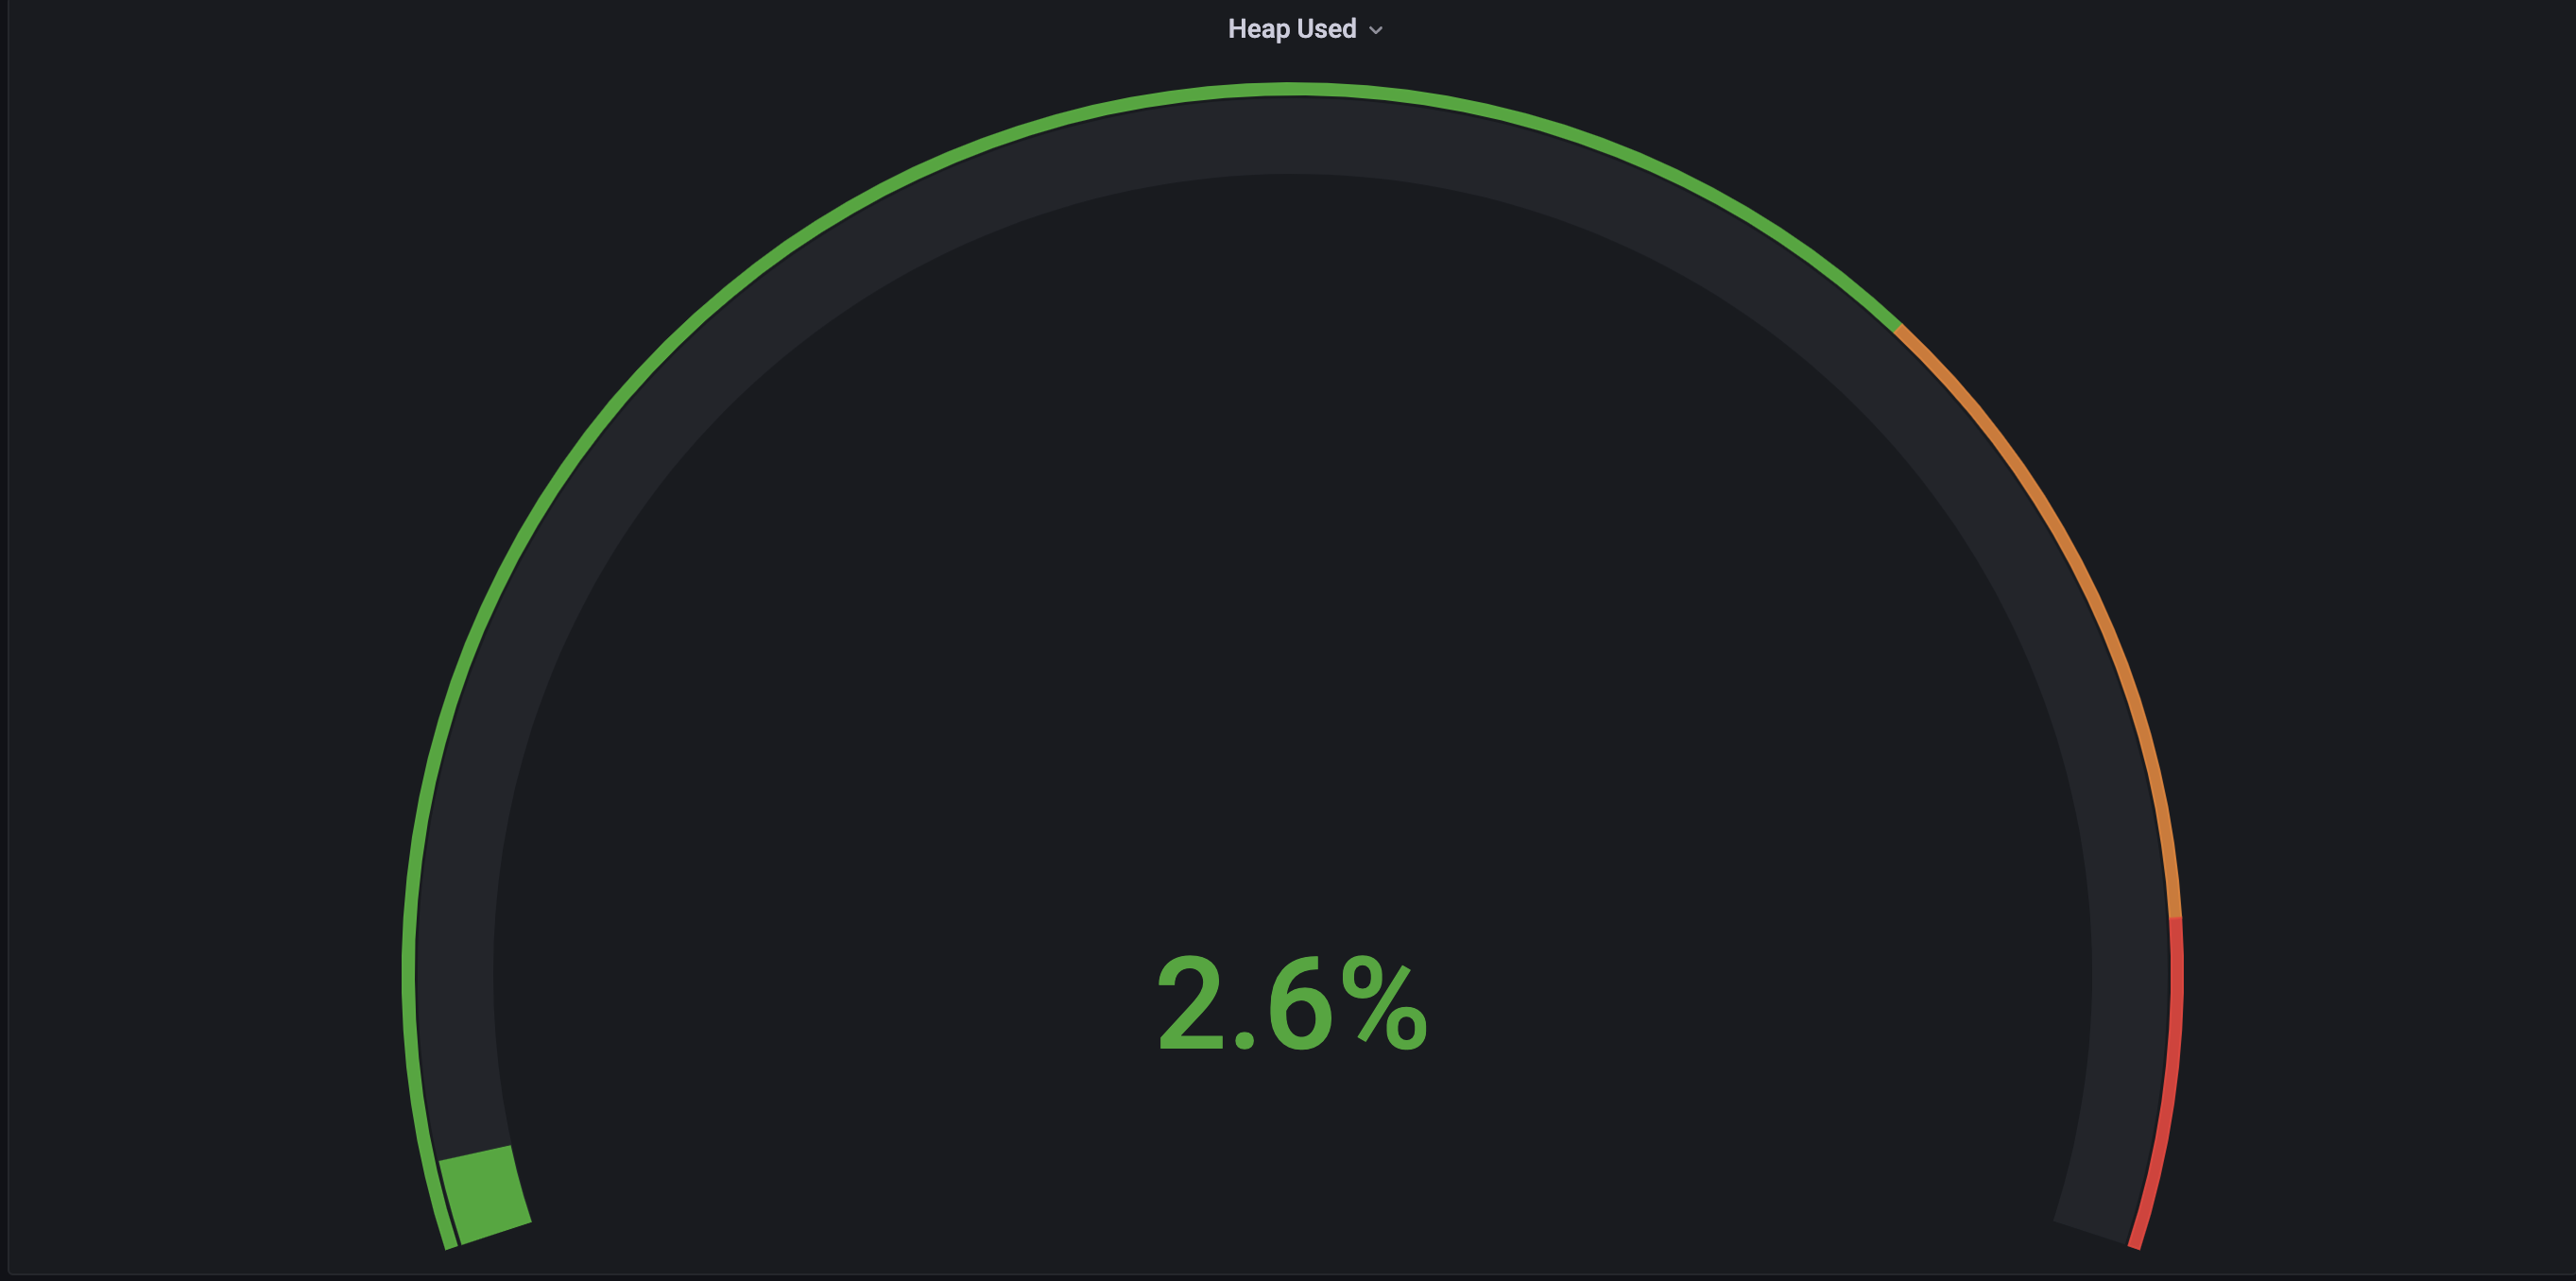
- 스레드 2개
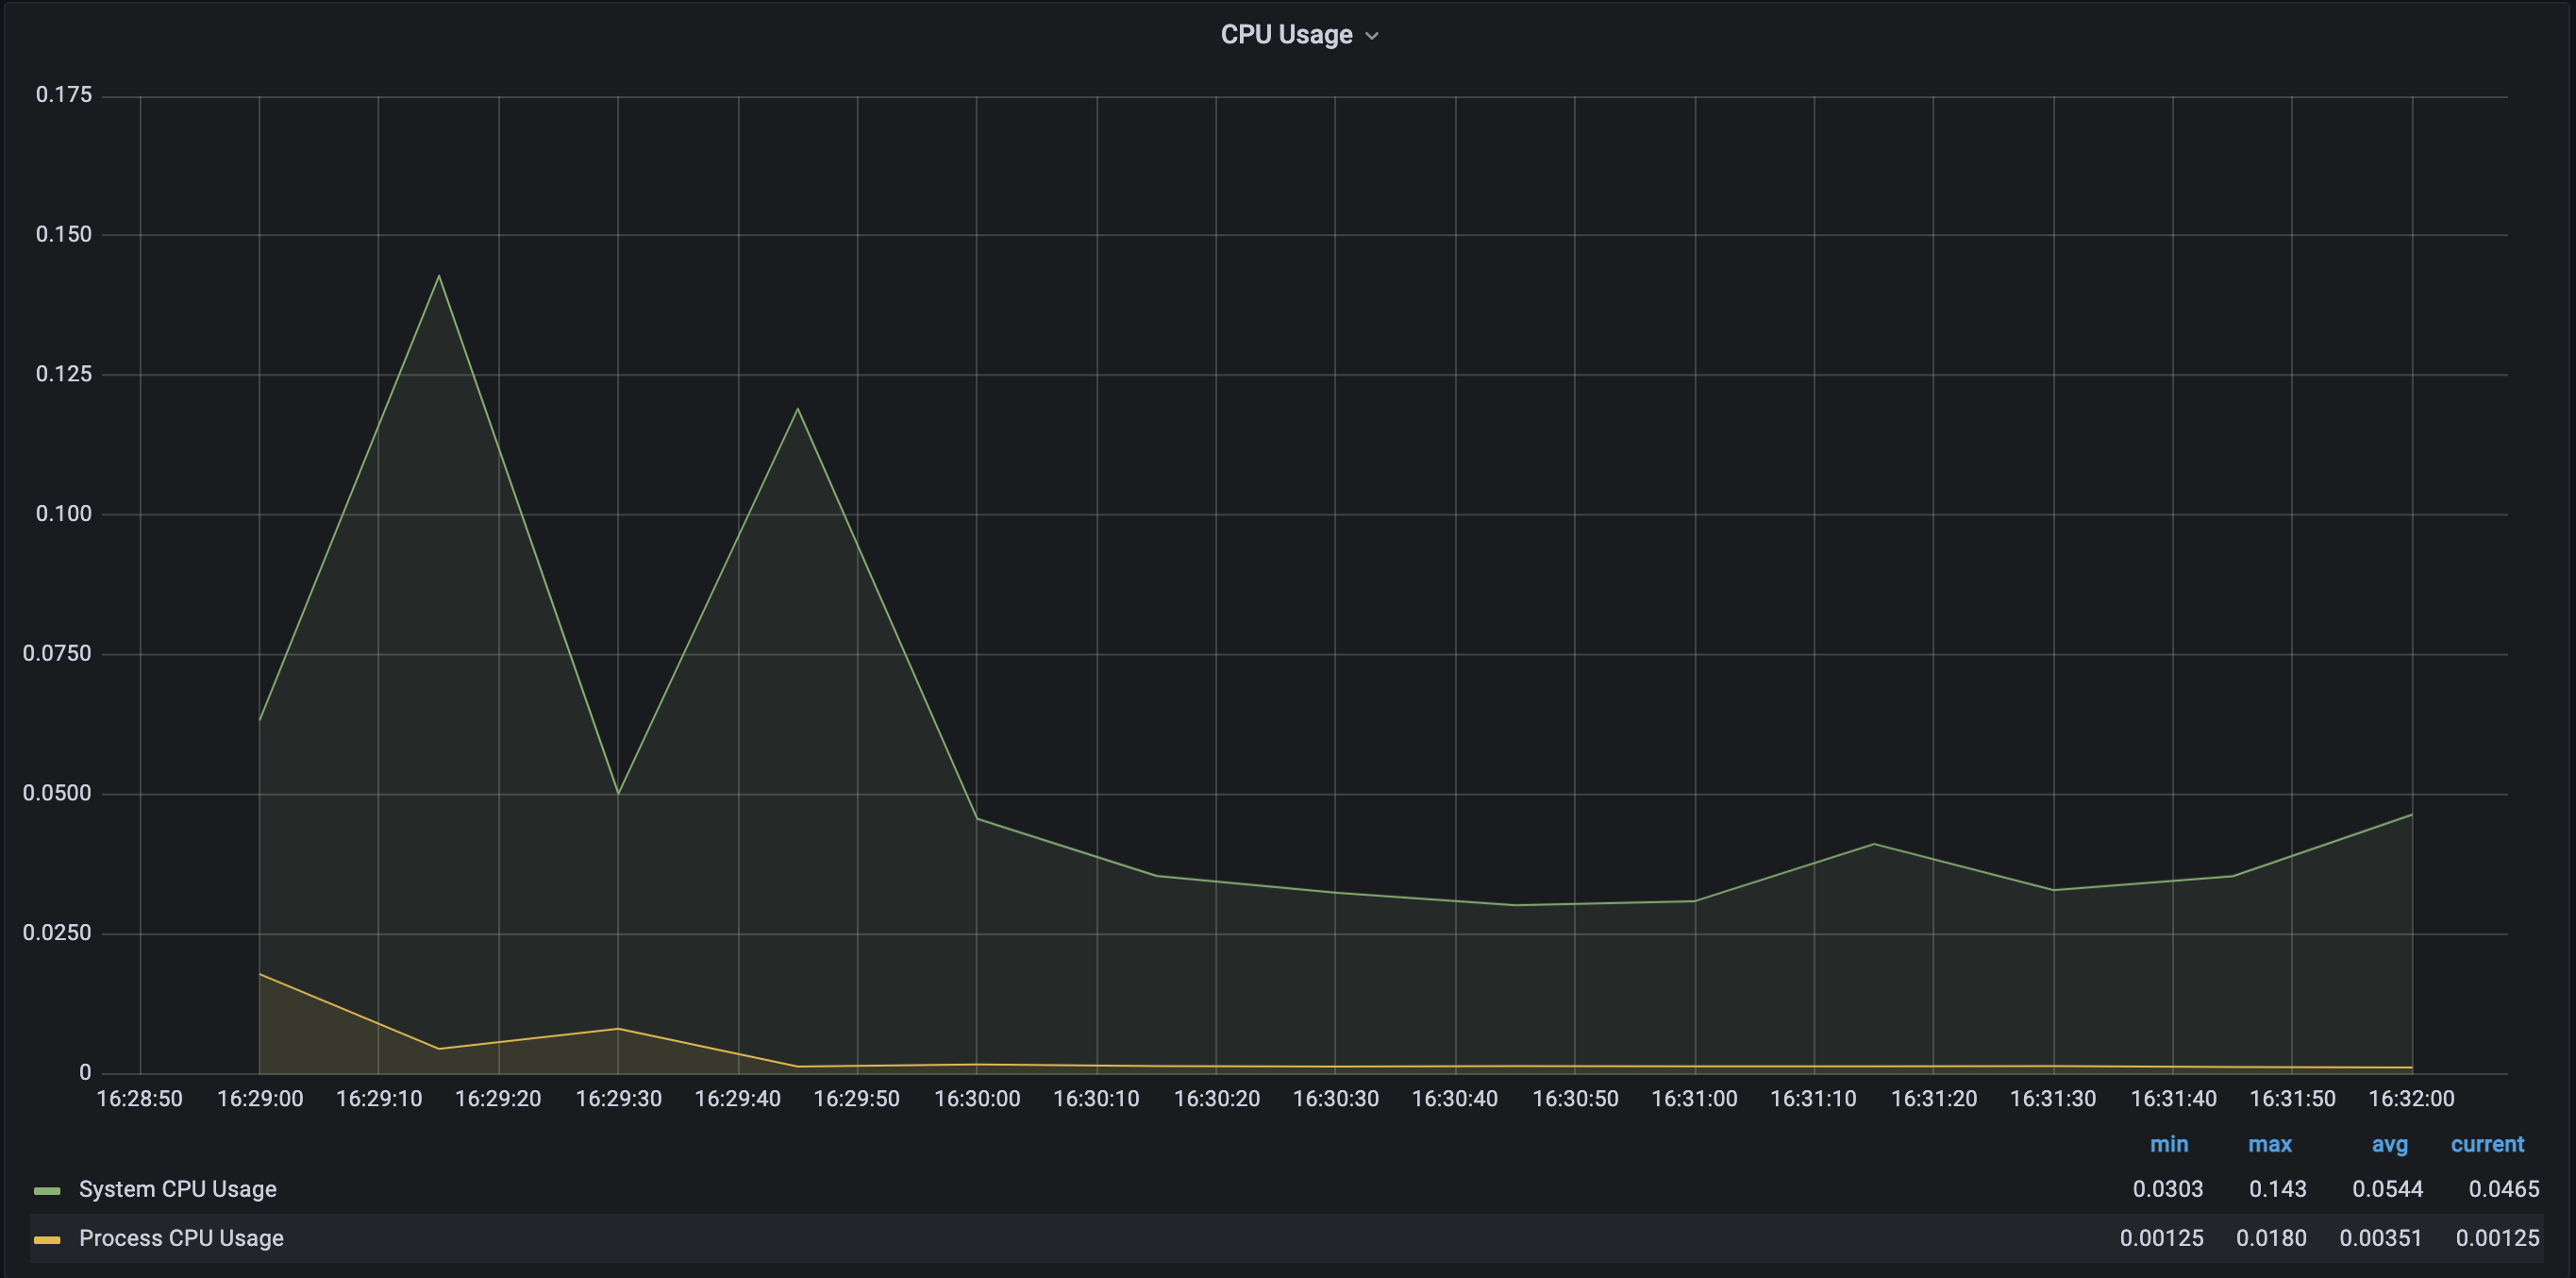
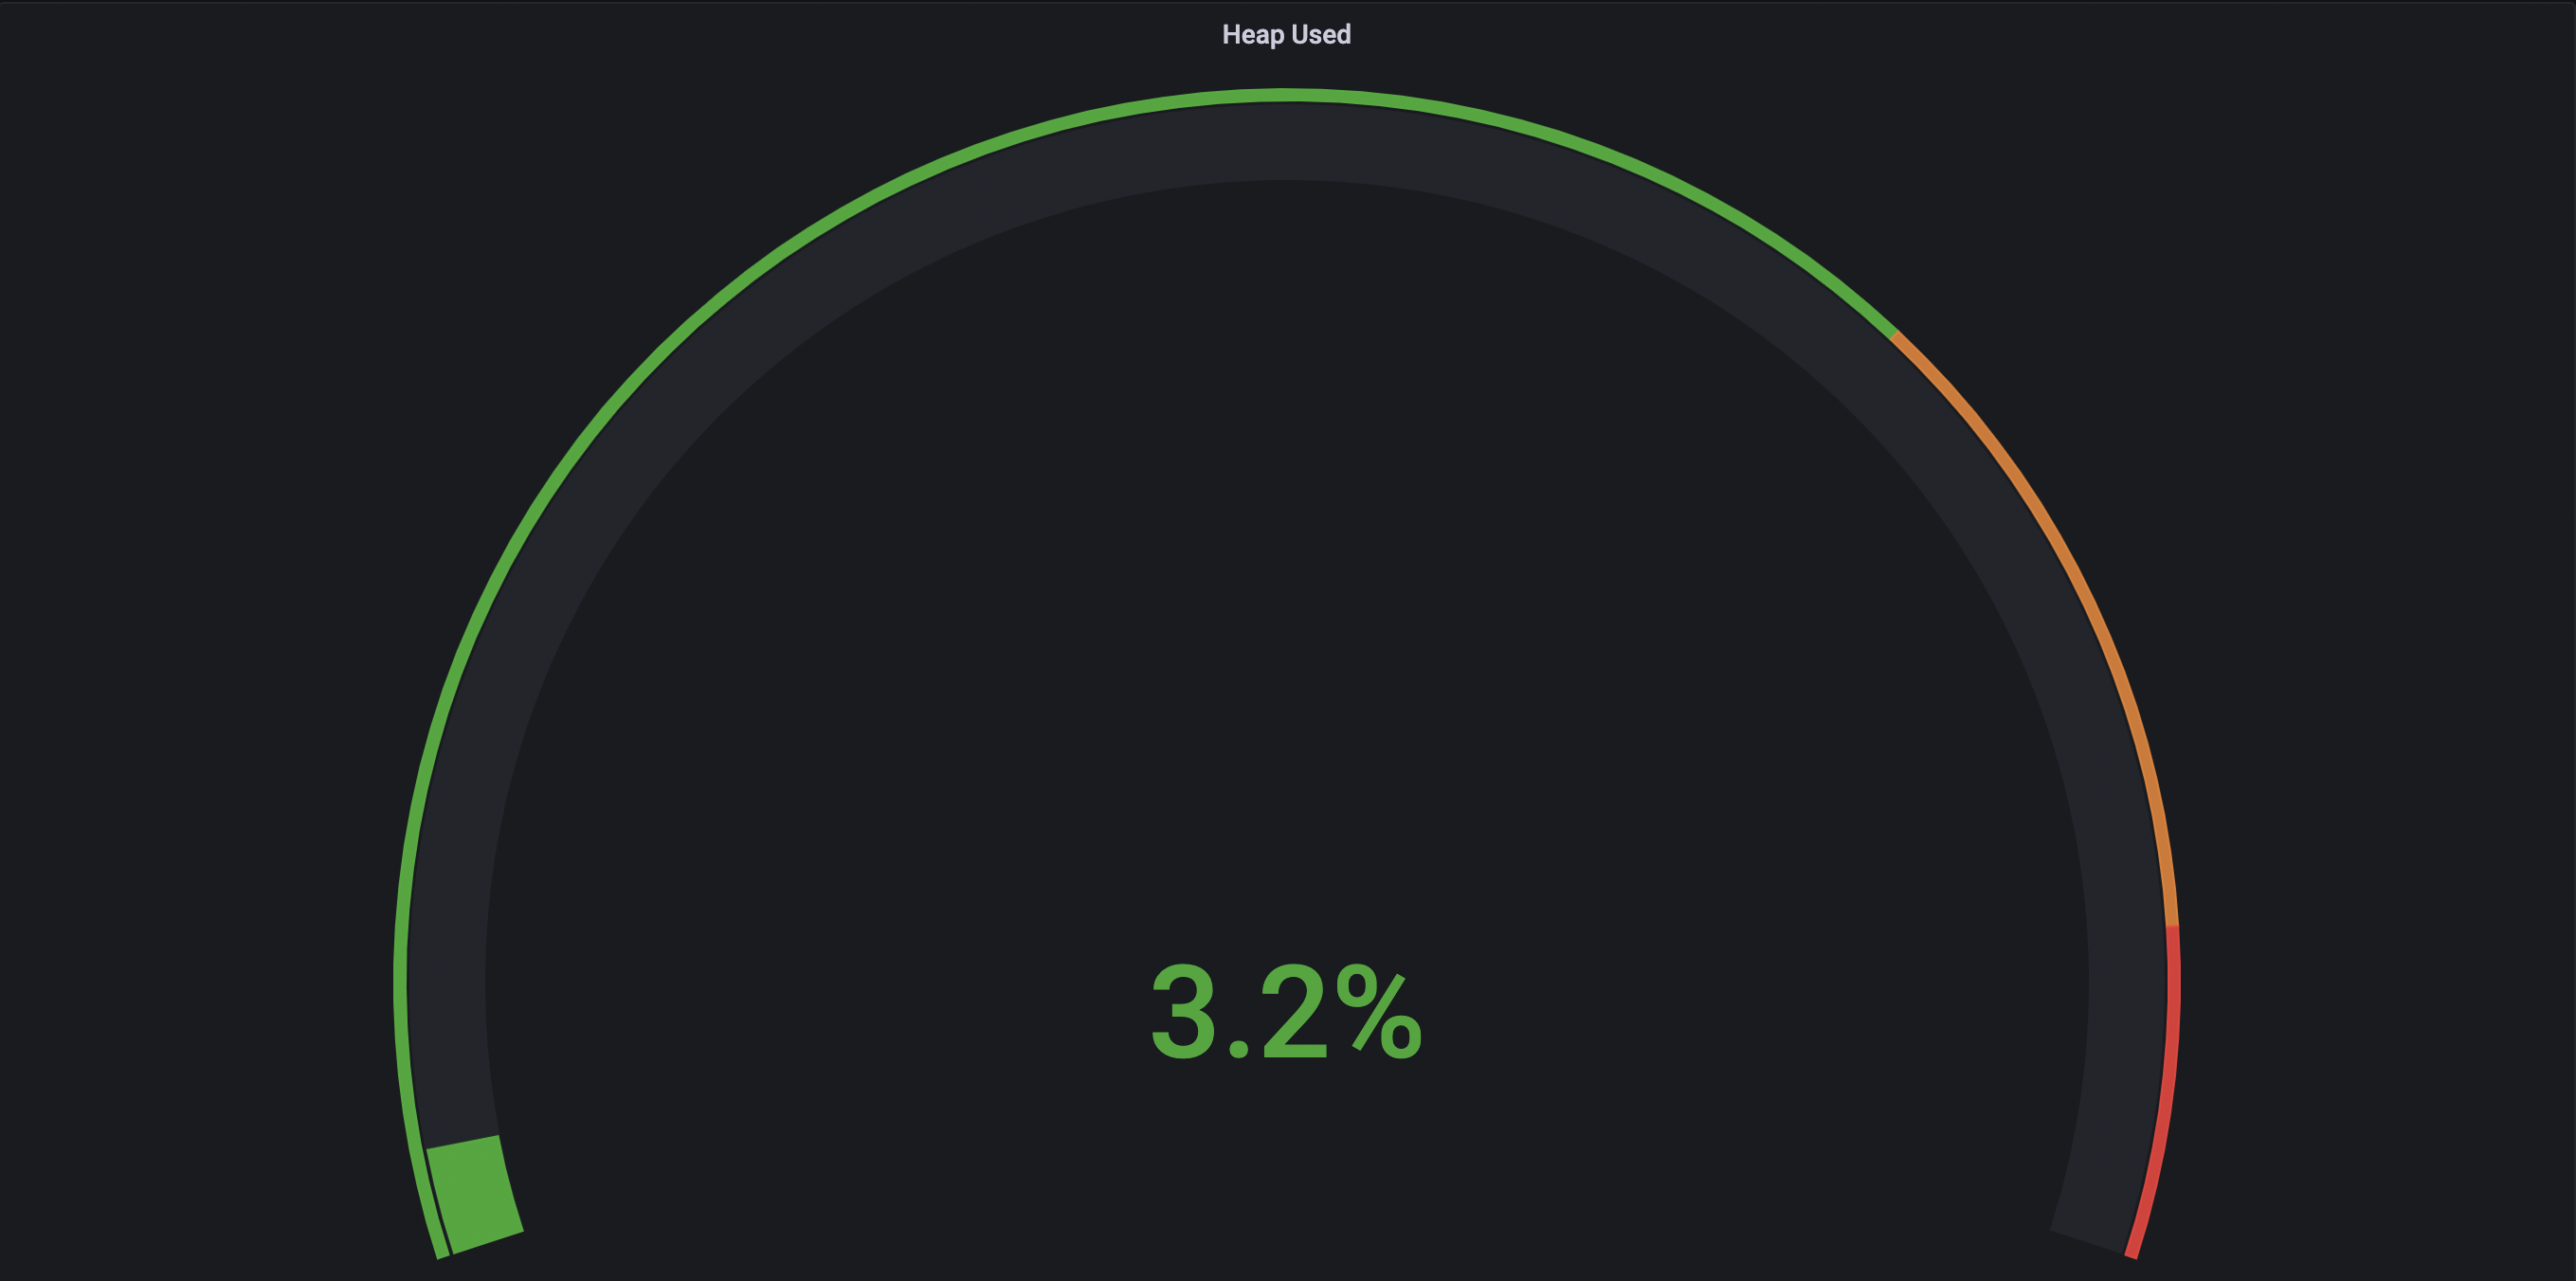
- 스레드 3개
- 스레드 4개
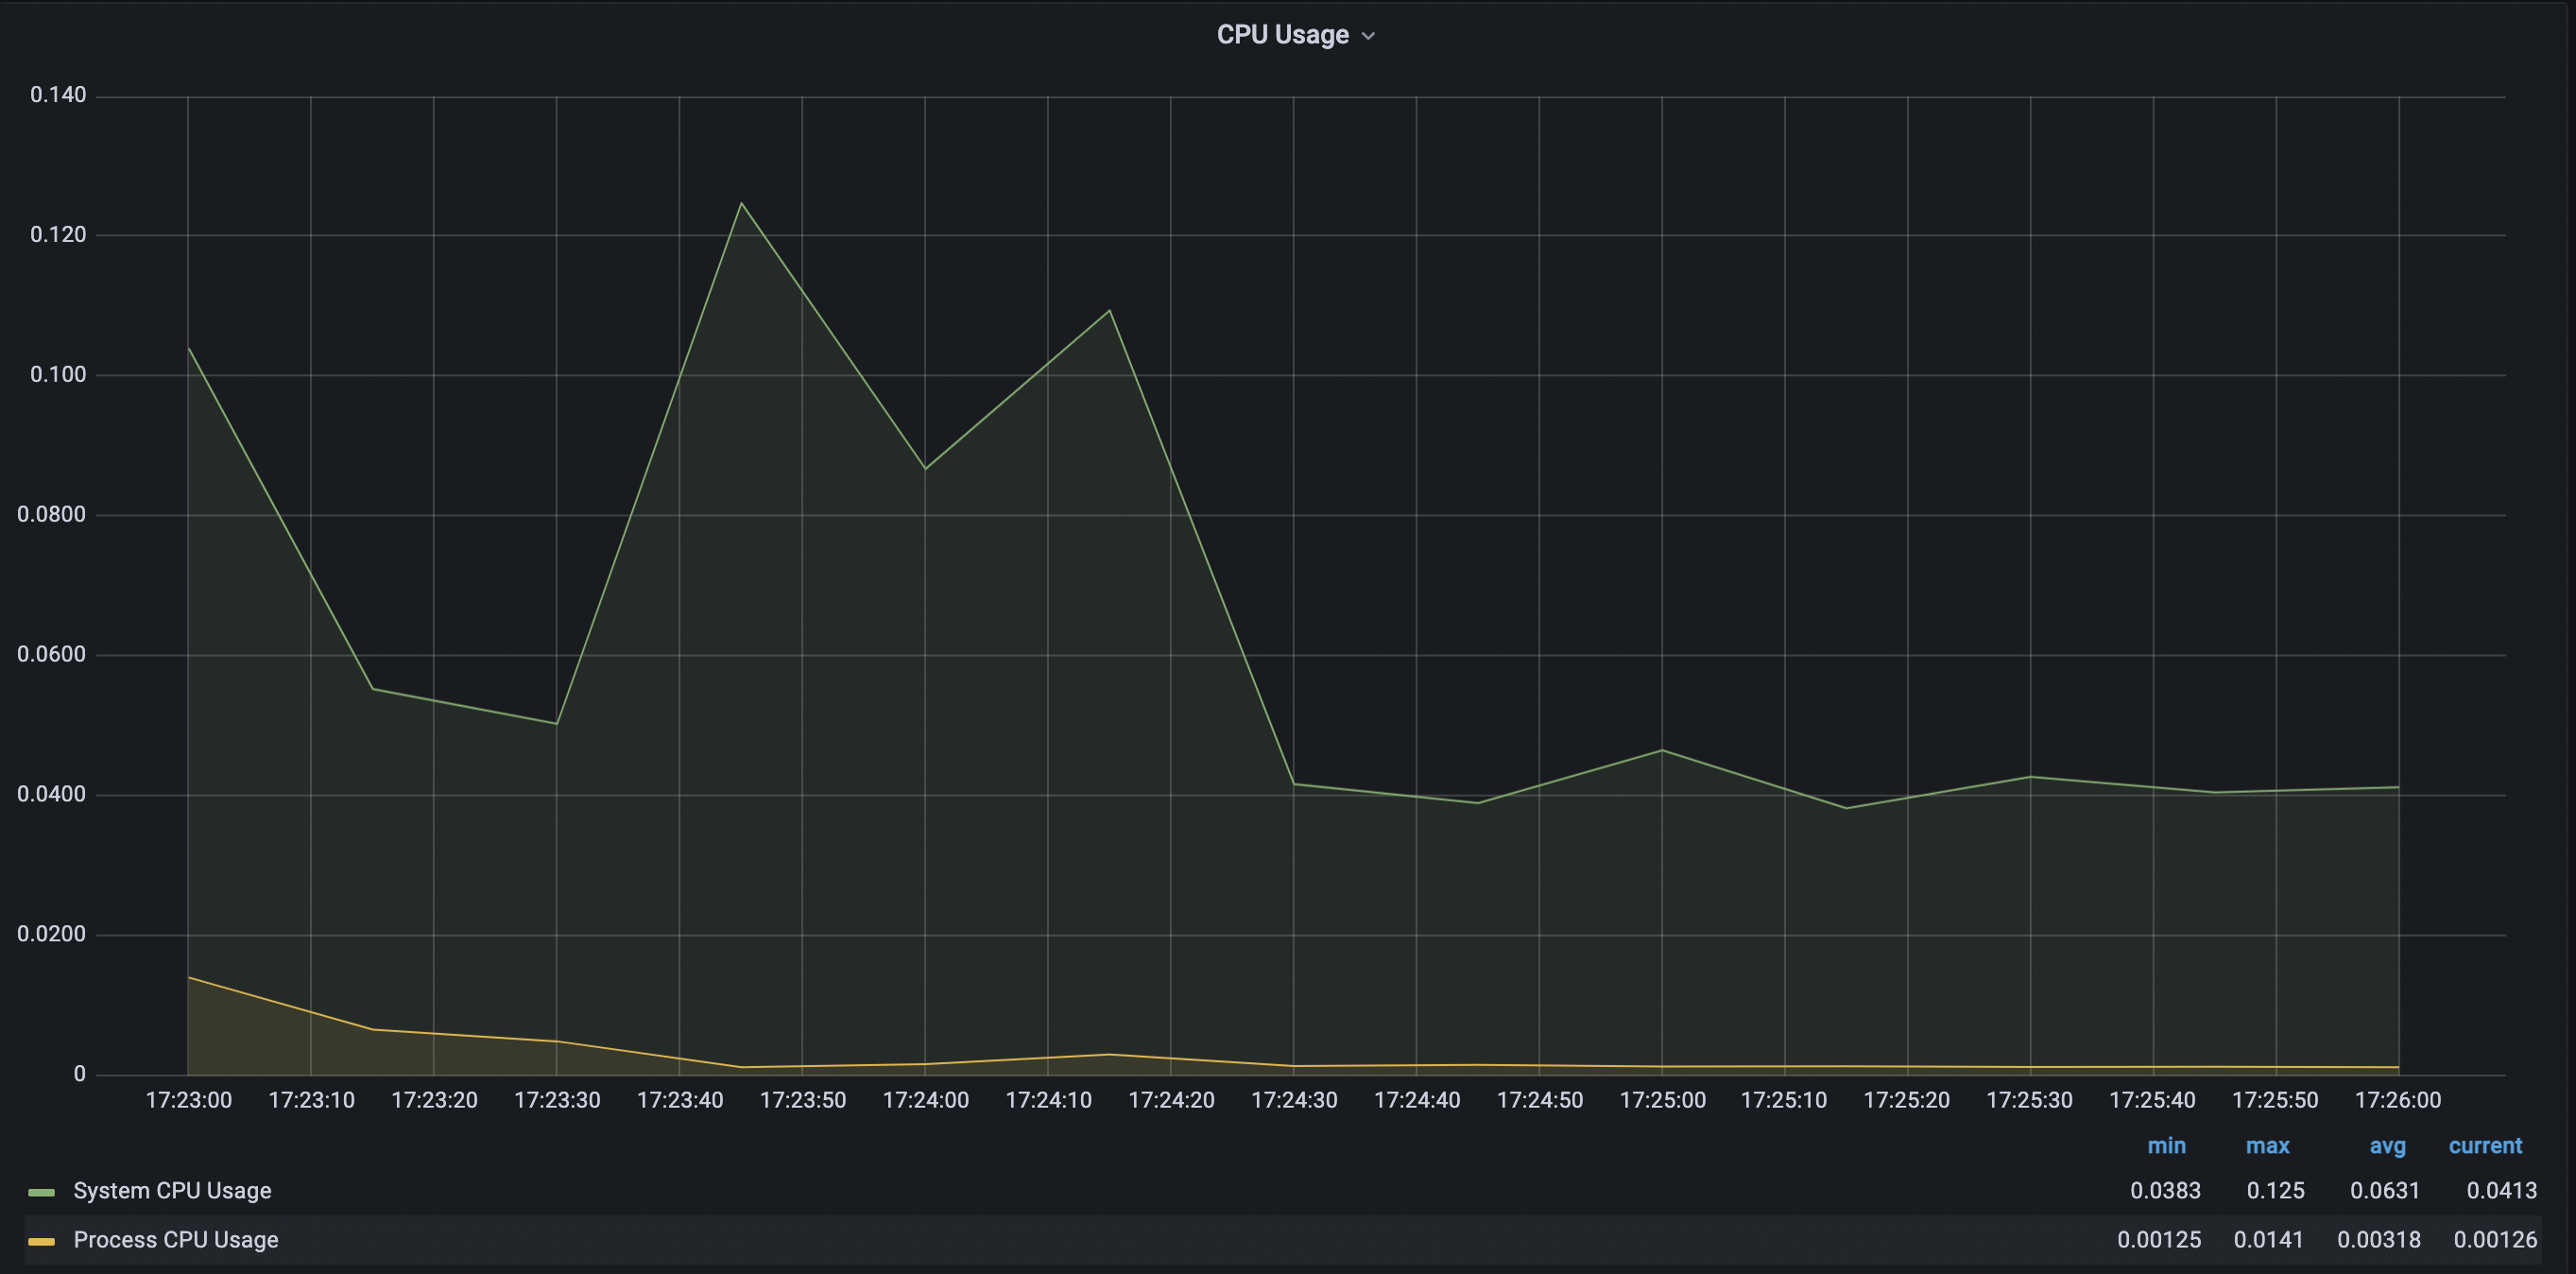
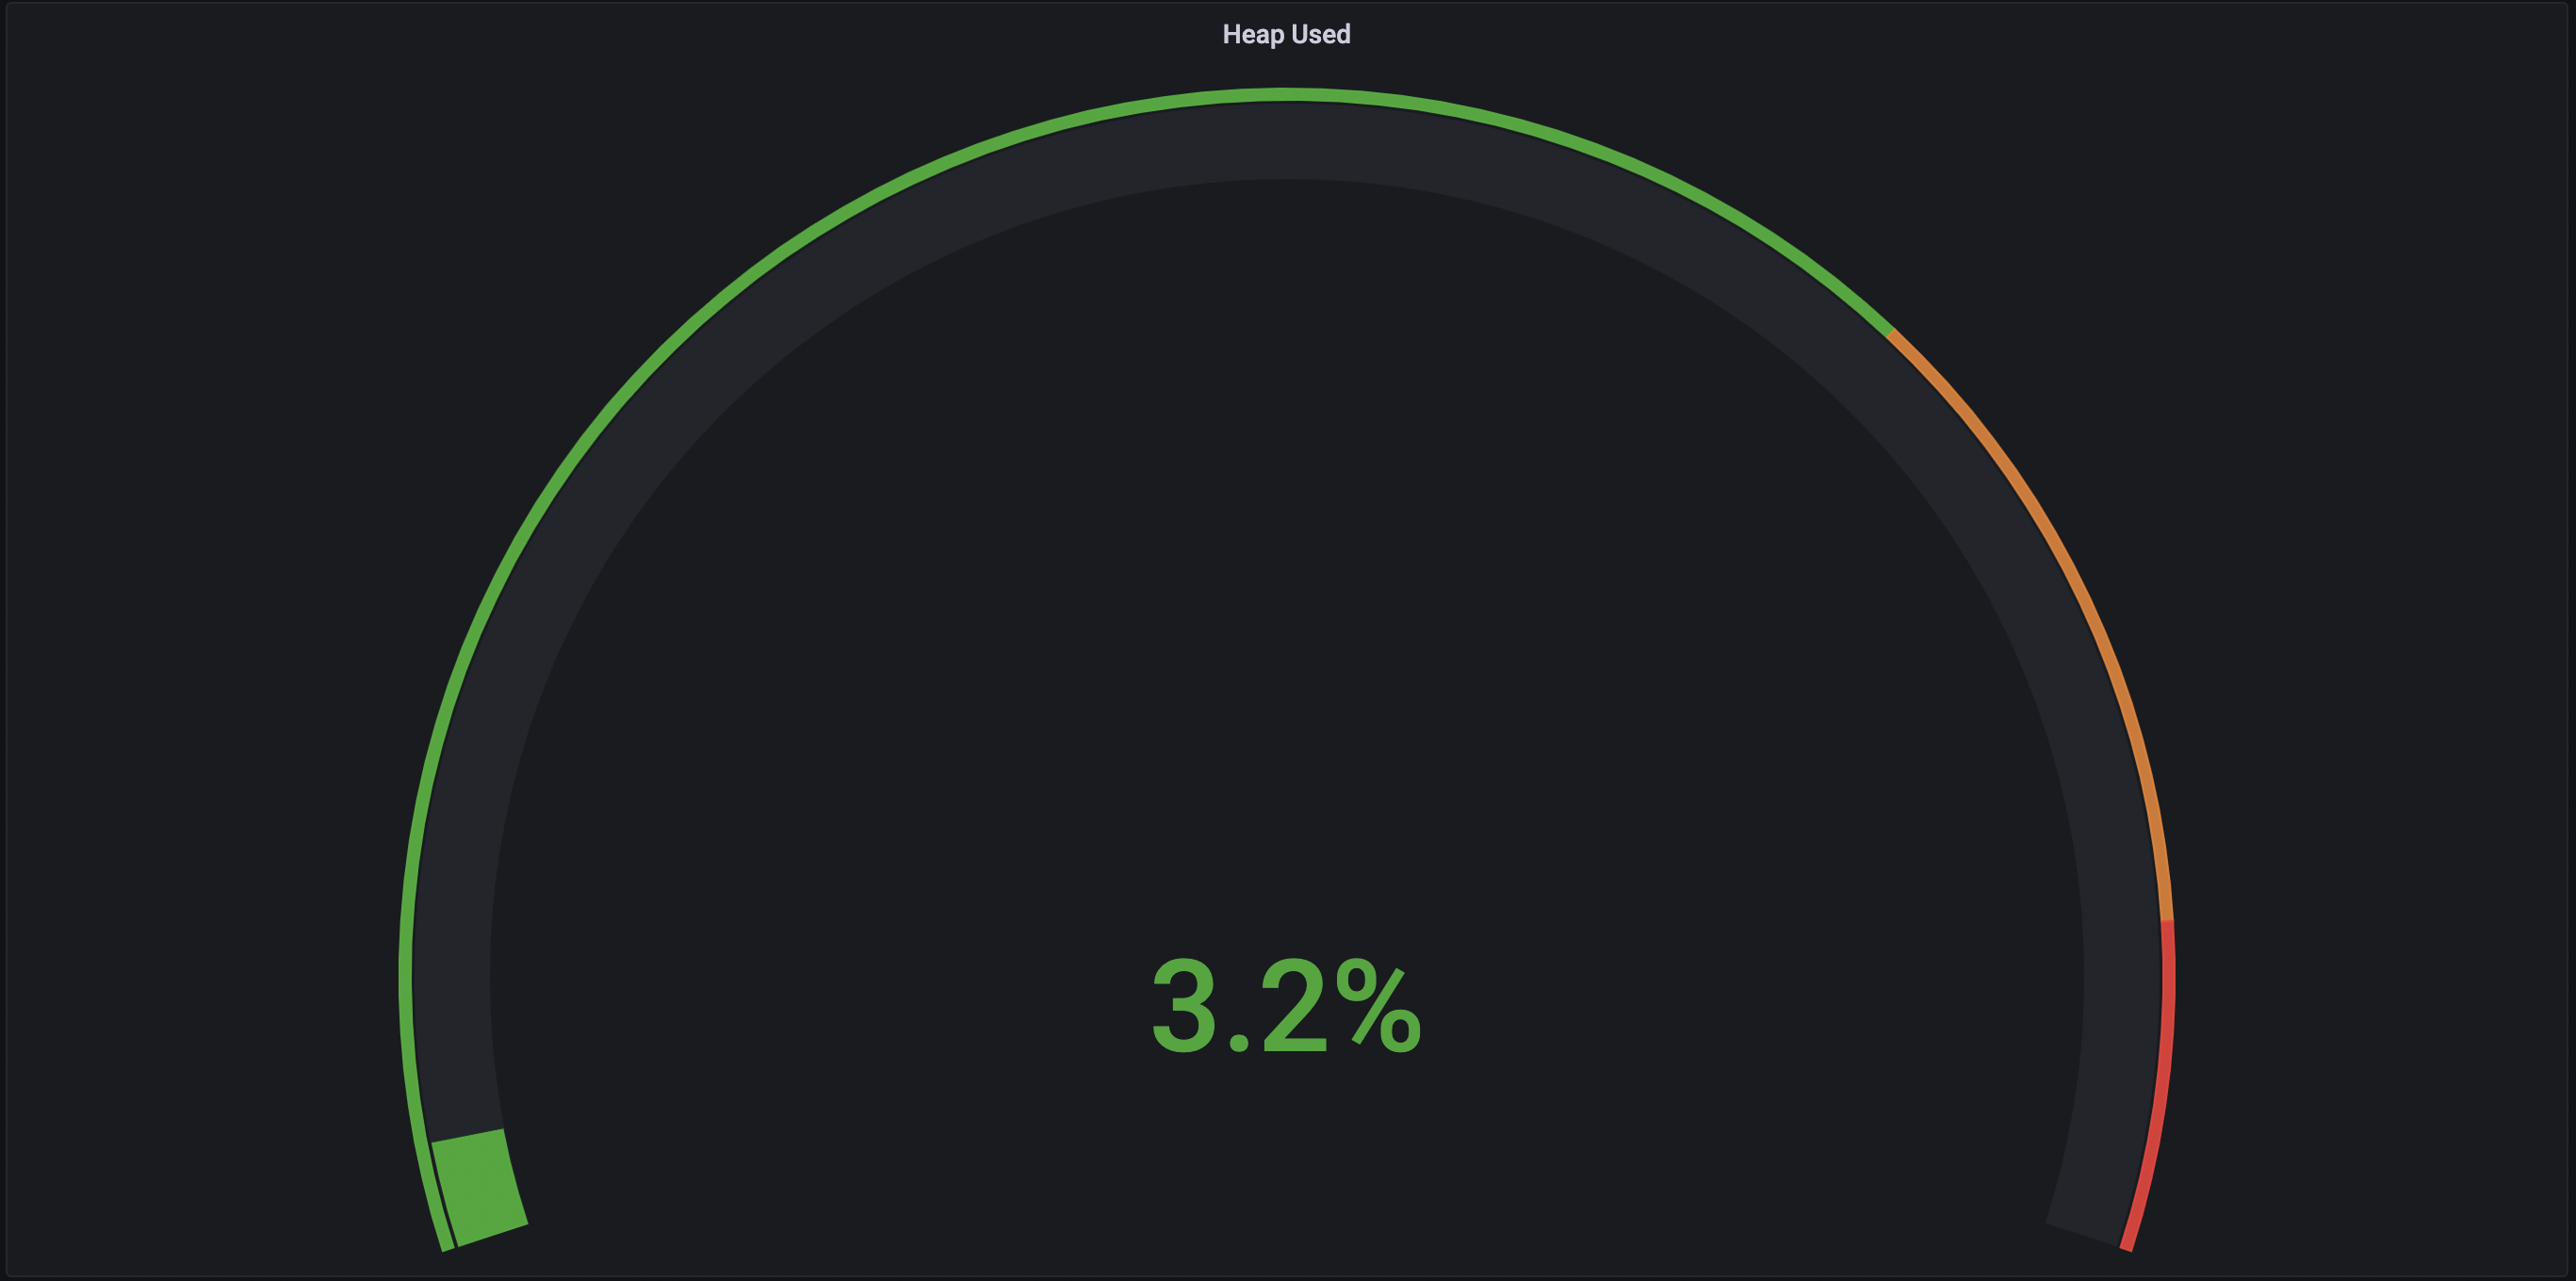
-> 스레드의 개수가 점점 늘어날수록 CPU의 점유율이 매우 조금 상승하는 것을 볼 수 있었고 힙 메모리 사용량은 큰 차이가 없었으며 Non-Heap 메모리 영역은 8.4% ~ 8.5% 로 일정했다. 각 스레드 별로 10번 테스트 케이스 실행시 Job 실행에 약 40 ~ 50초 정도 소요되었으며 스레드별 차이가 없었다.
고찰
- 로그를 찍어본 결과 API 통신에서 대부분 시간이 소요되는 것을 볼 수 있었다. 결국
@StepScope로 선언한 프록시 객체를 실제 빈으로 만들어서 메소드를 호출해야 한다. 이때 API 통신은 실제 빈을 만들기 위한 로직에 포함되어 있다. - 실제 빈을 얻기 위한 로직은 다음과 같다. 즉 동기화 되어 있기 때문에 멀티 스레드의 효과를 얻지 못한다.
@Override
public Object get(String name, ObjectFactory<?> objectFactory) {
    StepContext context = getContext();
    Object scopedObject = context.getAttribute(name);

    if (scopedObject == null) {

        synchronized (mutex) {
            scopedObject = context.getAttribute(name);
            if (scopedObject == null) {

                if (logger.isDebugEnabled()) {
                    logger.debug(String.format("Creating object in scope=%s, name=%s", this.getName(), name));
                }


                scopedObject = objectFactory.getObject();
                context.setAttribute(name, scopedObject);

            }

        }

    }
    return scopedObject;
}
- 해결 방안 모색
@StepScope가 아닌ThreadLocal을 이용한 paritioning을 생각해보았다. StepListener를 이용하여 Step 시작 전에 paging 변수를 스레드 단위 변수로 저장하려고 했지만 결국 처음 빈 생성시에NullPointerEx이 발생했다.@Async를 통한 AOP를 활용하여 비동기적으로 하면 어떨가 생각해보았다. 시간이 많이 소요되는 지점은 API 통신을 하는 부분인데 non-blocking 방식으로 코딩하면itemreader.read()순간에ReadEx이 발생했다.Job을 여러 개로 나눠서Quartz멀티 스레드 병렬 처리도 생각해보았다. 하지만 일정 간격으로 새로운item을 갖는itemreader를 새로 생성하기 위해서는 결국@StepScope를 통한 지연 로딩이 필요했다.
- 다음 포스팅에서는
Quartz를 통한Job의 스케줄링으로 위와 같은 문제를 개선해 보겠다.
댓글남기기